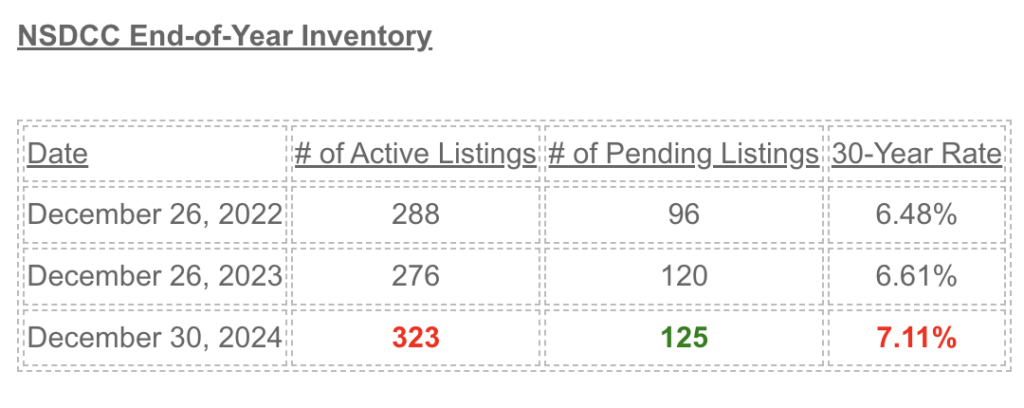
We’re going to start the new year with about 17% more houses for sale than we did in 2024. They will be joined by other failed listings from the past, and the inventory will most likely be rising faster than normal.
The first inventory count of 2024 was 255 homes for sale on January 2nd, and that number was 22% higher by the first week of February.
If the 2025 inventory grows about the same or a little faster, it means there will be 375-400 homes for sale by the end of February. It will be VERY EARLY in the season to have that many homes for sale already! We didn’t get to 400 until mid-May of this year!
Personally, though we are expecting a fast start in 2025, we aren’t going to publish our first home for sale until January 9th. It will begin a six-week stretch where we will be rolling out a new listing every Thursday!
~~~~~~~~~~~~~~~~~~~~~~~~~~~~~~~~~~~~~~~~
My Reasons Why NSDCC Inventory Will Surge in 2025:
1. Been trending that way – there has been 15% more NSDCC homes for sale this year than in 2023.
2. More listings have been cancelling this year than in Q423. They’ll be back!
3. Prop 19 was fun while it lasted – more of those who inherited a home will want to cash out.
4. Credit card debt is over $1 trillion for the first time. More current homeowners will lighten the load by paying off all their bills and downsize to cheaper home (probably out of state).
5. The affluent fleeing the country – if you have nothing tying you down here, then there are other choices.
6. The 5th anniversary of Covid is a few months away. Those who put off moving can go ahead now!
7. California politics drives people away. Gav’s $25 million to fight Trump? Might be the last straw for some.
8. I don’t have the statistics but more baby boomers should be shuffling off this mortal coil.
9. We’re all older – if you’re going to move, do it while you still can, physically!
10. Covid buyers with life changes – Flush with equity, they can sell and buy a better house.
The $0 – $1,500,000 Market:
| Date |
NSDCC Active Listings |
Avg. LP/sf |
Avg. DOM |
# of Pendings |
| Jan 2, 2024 |
15 |
$724/sf |
49 |
23 |
| Jan 8 |
13 |
$645/sf |
58 |
19 |
| Jan 15 |
10 |
$664/sf |
55 |
15 |
| Jan 22 |
15 |
$750/sf |
36 |
15 |
| Jan 29 |
12 |
$834/sf |
36 |
21 |
| Feb 5 |
12 |
$784/sf |
38 |
23 |
| Feb 12 |
10 |
$818/sf |
30 |
22 |
| Feb 19 |
12 |
$731/sf |
17 |
21 |
| Feb 26 |
7 |
$725/sf |
26 |
21 |
| Mar 4 |
9 |
$763/sf |
23 |
21 |
| Mar 11 |
15 |
$742/sf |
14 |
17 |
| Mar 18 |
15 |
$697/sf |
16 |
21 |
| Mar 25 |
13 |
$846/sf |
19 |
22 |
| Apr 1 |
12 |
$897/sf |
22 |
20 |
| Apr 8 |
15 |
$869/sf |
37 |
22 |
| Apr 15 |
17 |
$811/sf |
16 |
25 |
| Apr 22 |
18 |
$829/sf |
16 |
23 |
| Apr 29 |
20 |
$796/sf |
20 |
23 |
| May 6 |
19 |
$868/sf |
18 |
23 |
| May 13 |
21 |
$859/sf |
18 |
22 |
| May 20 |
25 |
$939/sf |
20 |
18 |
| May 27 |
24 |
$897/sf |
25 |
20 |
| Jun 3 |
22 |
$879/sf |
25 |
19 |
| Jun 10 |
25 |
$834/sf |
26 |
19 |
| Jun 17 |
21 |
$823/sf |
31 |
21 |
| Jun 24 |
24 |
$752/sf |
32 |
24 |
| Jul 1 |
23 |
$760/sf |
44 |
26 |
| Jul 8 |
22 |
$801/sf |
40 |
23 |
| Jul 15 |
22 |
$815/sf |
36 |
23 |
| Jul 22 |
17 |
$814/sf |
43 |
23 |
| Jul 29 |
24 |
$815/sf |
33 |
14 |
| Aug 5 |
23 |
$771/sf |
29 |
18 |
| Aug 12 |
22 |
$787/sf |
36 |
23 |
| Aug 19 |
24 |
$773/sf |
28 |
27 |
| Aug 26 |
24 |
$760/sf |
27 |
24 |
| Sep 2 |
28 |
$767/sf |
24 |
18 |
| Sep 9 |
27 |
$803/sf |
28 |
21 |
| Sep 16 |
32 |
$808/sf |
27 |
19 |
| Sep 23 |
37 |
$791/sf |
24 |
17 |
| Sep 30 |
31 |
$892/sf |
29 |
23 |
| Oct 7 |
36 |
$836/sf |
28 |
18 |
| Oct 14 |
34 |
$818/sf |
30 |
20 |
| Oct 21 |
36 |
$834/sf |
32 |
20 |
| Oct 28 |
36 |
$893/sf |
36 |
19 |
| Nov 4 |
34 |
$885/sf |
35 |
20 |
| Nov 11 |
30 |
$880/sf |
40 |
22 |
| Nov 18 |
30 |
$890/sf |
40 |
21 |
| Nov 25 |
27 |
$907/sf |
42 |
25 |
| Dec 2 |
23 |
$945/sf |
53 |
24 |
| Dec 9 |
23 |
$925/sf |
52 |
17 |
| Dec 16 |
22 |
$890/sf |
62 |
14 |
| Dec 23 |
19 |
$956/sf |
61 |
12 |
| Dec 30 |
16 |
$981/sf |
67 |
14 |
The $1,500,000 – $2,000,000 Market:
| Date |
NSDCC Active Listings |
Avg. LP/sf |
Avg. DOM |
# of Pendings |
| Jan 2, 2024 |
20 |
$866/sf |
66 |
28 |
| Jan 8 |
23 |
$890/sf |
63 |
23 |
| Jan 15 |
32 |
$876/sf |
47 |
35 |
| Jan 22 |
35 |
$823/sf |
43 |
25 |
| Jan 29 |
38 |
$833/sf |
43 |
26 |
| Feb 5 |
39 |
$810/sf |
34 |
28 |
| Feb 12 |
32 |
$781/sf |
39 |
34 |
| Feb 19 |
33 |
$797/sf |
36 |
29 |
| Feb 26 |
33 |
$840/sf |
36 |
31 |
| Mar 4 |
39 |
$827/sf |
32 |
31 |
| Mar 11 |
30 |
$857/sf |
43 |
37 |
| Mar 18 |
34 |
$847/sf |
36 |
37 |
| Mar 25 |
34 |
$848/sf |
43 |
43 |
| Apr 1 |
23 |
$873/sf |
42 |
47 |
| Apr 8 |
30 |
$884/sf |
37 |
47 |
| Apr 15 |
32 |
$961/sf |
36 |
43 |
| Apr 22 |
36 |
$964/sf |
31 |
37 |
| Apr 29 |
44 |
$921/sf |
25 |
33 |
| May 6 |
44 |
$921/sf |
30 |
36 |
| May 13 |
46 |
$939/sf |
25 |
34 |
| May 20 |
47 |
$965/sf |
24 |
38 |
| May 27 |
47 |
$965/sf |
30 |
40 |
| Jun 3 |
53 |
$1,006/sf |
32 |
36 |
| Jun 10 |
61 |
$942/sf |
30 |
36 |
| Jun 17 |
62 |
$909/sf |
30 |
37 |
| Jun 24 |
62 |
$909/sf |
28 |
40 |
| Jul 1 |
70 |
$883/sf |
30 |
43 |
| Jul 8 |
67 |
$925/sf |
30 |
47 |
| Jul 15 |
70 |
$888/sf |
31 |
51 |
| Jul 22 |
61 |
$858/sf |
35 |
46 |
| Jul 29 |
57 |
$859/sf |
38 |
50 |
| Aug 5 |
56 |
$892/sf |
37 |
41 |
| Aug 12 |
62 |
$895/sf |
39 |
40 |
| Aug 19 |
67 |
$879/sf |
36 |
36 |
| Aug 26 |
62 |
$899/sf |
39 |
41 |
| Sep 2 |
52 |
$912/sf |
41 |
41 |
| Sep 9 |
53 |
$889/sf |
37 |
37 |
| Sep 16 |
50 |
$877/sf |
39 |
35 |
| Sep 23 |
55 |
$902/sf |
37 |
33 |
| Sep 30 |
61 |
$894/sf |
37 |
32 |
| Oct 7 |
67 |
$899/sf |
37 |
32 |
| Oct 14 |
65 |
$889/sf |
42 |
34 |
| Oct 21 |
65 |
$880/sf |
40 |
34 |
| Oct 28 |
64 |
$877/sf |
38 |
29 |
| Nov 4 |
71 |
$888/sf |
43 |
28 |
| Nov 11 |
72 |
$879/sf |
43 |
28 |
| Nov 18 |
64 |
$912/sf |
49 |
34 |
| Nov 25 |
57 |
$919/sf |
52 |
40 |
| Dec 2 |
47 |
$925/sf |
58 |
41 |
| Dec 9 |
46 |
$959/sf |
55 |
37 |
| Dec 16 |
37 |
$1,007/sf |
64 |
43 |
| Dec 23 |
33 |
$1,004/sf |
71 |
33 |
| Dec 30 |
34 |
$1,016/sf |
78 |
28 |
The $2,000,000 – $3,000,000 Market:
| Date |
NSDCC Active Listings |
Avg. LP/sf |
Avg. DOM |
# of Pendings |
| Jan 2, 2024 |
54 |
$1,046/sf |
65 |
34 |
| Jan 8 |
59 |
$1,034/sf |
57 |
30 |
| Jan 15 |
69 |
$1,094/sf |
44 |
35 |
| Jan 22 |
60 |
$1,108/sf |
42 |
45 |
| Jan 29 |
65 |
$1,126/sf |
41 |
48 |
| Feb 5 |
68 |
$1,120/sf |
31 |
50 |
| Feb 12 |
60 |
$1,123/sf |
34 |
56 |
| Feb 19 |
71 |
$1,130/sf |
29 |
56 |
| Feb 26 |
64 |
$1,138/sf |
30 |
61 |
| Mar 4 |
62 |
$1,202/sf |
33 |
55 |
| Mar 11 |
61 |
$1,211/sf |
29 |
62 |
| Mar 18 |
72 |
$1,143/sf |
32 |
53 |
| Mar 25 |
70 |
$1,101/sf |
31 |
64 |
| Apr 1 |
71 |
$1,049/sf |
31 |
63 |
| Apr 8 |
68 |
$1,076/sf |
31 |
63 |
| Apr 15 |
82 |
$1,058/sf |
33 |
55 |
| Apr 22 |
81 |
$1,066/sf |
38 |
62 |
| Apr 29 |
79 |
$1,076/sf |
34 |
64 |
| May 6 |
77 |
$1,067/sf |
35 |
56 |
| May 13 |
78 |
$1,069/sf |
38 |
58 |
| May 20 |
93 |
$1,049/sf |
39 |
46 |
| May 27 |
92 |
$1,053/sf |
39 |
47 |
| Jun 3 |
105 |
$1,025/sf |
41 |
43 |
| Jun 10 |
105 |
$1,035/sf |
40 |
53 |
| Jun 17 |
107 |
$1,002/sf |
36 |
51 |
| Jun 24 |
118 |
$1,034/sf |
35 |
58 |
| Jul 1 |
111 |
$1,013/sf |
37 |
59 |
| Jul 8 |
111 |
$1,019/sf |
41 |
58 |
| Jul 15 |
120 |
$1,014/sf |
43 |
47 |
| Jul 22 |
124 |
$972/sf |
41 |
47 |
| Jul 29 |
124 |
$974/sf |
41 |
40 |
| Aug 5 |
117 |
$978/sf |
43 |
44 |
| Aug 12 |
114 |
$964/sf |
45 |
42 |
| Aug 19 |
112 |
$982/sf |
45 |
43 |
| Aug 26 |
107 |
$957/sf |
42 |
47 |
| Sep 2 |
102 |
$945/sf |
44 |
49 |
| Sep 9 |
101 |
$965/sf |
45 |
51 |
| Sep 16 |
103 |
$982/sf |
43 |
50 |
| Sep 23 |
99 |
$986/sf |
44 |
58 |
| Sep 30 |
108 |
$984/sf |
44 |
42 |
| Oct 7 |
103 |
$1,006/sf |
44 |
47 |
| Oct 14 |
96 |
$979/sf |
49 |
49 |
| Oct 21 |
104 |
$993/sf |
50 |
46 |
| Oct 28 |
102 |
$992/sf |
54 |
44 |
| Nov 4 |
98 |
$1,000/sf |
53 |
35 |
| Nov 11 |
94 |
$1,002/sf |
55 |
35 |
| Nov 18 |
91 |
$993/sf |
57 |
42 |
| Nov 25 |
81 |
$971/sf |
58 |
40 |
| Dec 2 |
73 |
$996/sf |
60 |
41 |
| Dec 9 |
83 |
$1,043/sf |
52 |
44 |
| Dec 16 |
83 |
$1,038/sf |
55 |
43 |
| Dec 23 |
69 |
$1,031/sf |
63 |
44 |
| Dec 30 |
60 |
$1,041/sf |
72 |
42 |
The $3,000,000 – $4,000,000 Market:
| Date |
NSDCC Active Listings |
Avg. LP/sf |
Avg. DOM |
# of Pendings |
| Jan 2, 2024 |
33 |
$1,216/sf |
92 |
15 |
| Jan 8 |
37 |
$1,248/sf |
83 |
15 |
| Jan 15 |
42 |
$1,236/sf |
77 |
18 |
| Jan 22 |
43 |
$1,283/sf |
77 |
17 |
| Jan 29 |
42 |
$1,242/sf |
75 |
20 |
| Feb 5 |
36 |
$1,363/sf |
73 |
25 |
| Feb 12 |
40 |
$1,252/sf |
34 |
18 |
| Feb 19 |
47 |
$1,515/sf |
45 |
17 |
| Feb 26 |
50 |
$1,512/sf |
42 |
16 |
| Mar 4 |
50 |
$1,588/sf |
44 |
19 |
| Mar 11 |
50 |
$1,594/sf |
44 |
23 |
| Mar 18 |
60 |
$1,537/sf |
38 |
22 |
| Mar 25 |
59 |
$1,614/sf |
70 |
27 |
| Apr 1 |
62 |
$1,660/sf |
76 |
26 |
| Apr 8 |
65 |
$1,479/sf |
76 |
27 |
| Apr 15 |
72 |
$1,442/sf |
70 |
26 |
| Apr 22 |
70 |
$1,462/sf |
75 |
20 |
| Apr 29 |
68 |
$1,434/sf |
75 |
25 |
| May 6 |
67 |
$1,373/sf |
70 |
26 |
| May 13 |
71 |
$1,355/sf |
68 |
25 |
| May 20 |
78 |
$1,298/sf |
63 |
24 |
| May 27 |
79 |
$1,267/sf |
66 |
26 |
| Jun 3 |
75 |
$1,272/sf |
65 |
26 |
| Jun 10 |
81 |
$1,248/sf |
62 |
26 |
| Jun 17 |
89 |
$1,195/sf |
59 |
28 |
| Jun 24 |
84 |
$1,229/sf |
61 |
33 |
| Jul 1 |
87 |
$1,227/sf |
62 |
31 |
| Jul 8 |
77 |
$1,278/sf |
68 |
33 |
| Jul 15 |
91 |
$1,263/sf |
63 |
31 |
| Jul 22 |
82 |
$1,272/sf |
68 |
31 |
| Jul 29 |
84 |
$1,221/sf |
67 |
25 |
| Aug 5 |
80 |
$1,180/sf |
71 |
22 |
| Aug 12 |
80 |
$1,196/sf |
70 |
24 |
| Aug 19 |
80 |
$1,145/sf |
45 |
26 |
| Aug 26 |
80 |
$1,118/sf |
44 |
22 |
| Sep 2 |
81 |
$1,144/sf |
47 |
23 |
| Sep 9 |
84 |
$1,143/sf |
46 |
23 |
| Sep 16 |
84 |
$1,168/sf |
47 |
23 |
| Sep 23 |
88 |
$1,141/sf |
49 |
21 |
| Sep 30 |
83 |
$1,159/sf |
52 |
21 |
| Oct 7 |
89 |
$1,159/sf |
51 |
21 |
| Oct 14 |
85 |
$1,223/sf |
56 |
25 |
| Oct 21 |
86 |
$1,225/sf |
52 |
29 |
| Oct 28 |
77 |
$1,216/sf |
61 |
28 |
| Nov 4 |
75 |
$1,213/sf |
63 |
28 |
| Nov 11 |
77 |
$1,242/sf |
64 |
24 |
| Nov 18 |
76 |
$1,177/sf |
60 |
21 |
| Nov 25 |
63 |
$1,179/sf |
61 |
21 |
| Dec 2 |
63 |
$1,180/sf |
60 |
17 |
| Dec 9 |
67 |
$1,167/sf |
60 |
15 |
| Dec 16 |
64 |
$1,152/sf |
65 |
15 |
| Dec 23 |
53 |
$1,112/sf |
65 |
16 |
| Dec 30 |
49 |
$1,124/sf |
70 |
15 |
The $4,000,000+ Market:
| Date |
NSDCC Active Listings |
Avg. LP/sf |
Avg. DOM |
# of Pendings |
| Jan 2, 2024 |
139 |
$1,858/sf |
116 |
20 |
| Jan 8 |
151 |
$1,896/sf |
109 |
18 |
| Jan 15 |
157 |
$1,879/sf |
106 |
22 |
| Jan 22 |
159 |
$1,824/sf |
104 |
27 |
| Jan 29 |
162 |
$1,758/sf |
108 |
31 |
| Feb 5 |
162 |
$1,718/sf |
108 |
30 |
| Feb 12 |
154 |
$1,705/sf |
107 |
34 |
| Feb 19 |
168 |
$1,685/sf |
107 |
24 |
| Feb 26 |
175 |
$1,691/sf |
105 |
26 |
| Mar 4 |
166 |
$1,692/sf |
97 |
36 |
| Mar 11 |
178 |
$1,663/sf |
90 |
37 |
| Mar 18 |
179 |
$1,691/sf |
90 |
29 |
| Mar 25 |
177 |
$1,693/sf |
83 |
34 |
| Apr 1 |
176 |
$1,713/sf |
87 |
31 |
| Apr 8 |
177 |
$1,771/sf |
82 |
37 |
| Apr 15 |
179 |
$1,731/sf |
88 |
40 |
| Apr 22 |
183 |
$1,733/sf |
85 |
42 |
| Apr 29 |
187 |
$1,765/sf |
81 |
42 |
| May 6 |
191 |
$1,751/sf |
83 |
42 |
| May 13 |
184 |
$1,754/sf |
84 |
47 |
| May 20 |
193 |
$1,734/sf |
81 |
45 |
| May 27 |
202 |
$1,716/sf |
78 |
46 |
| Jun 3 |
203 |
$1,694/sf |
74 |
43 |
| Jun 10 |
206 |
$1,716/sf |
70 |
43 |
| Jun 17 |
204 |
$1,666/sf |
68 |
41 |
| Jun 24 |
208 |
$1,678/sf |
68 |
44 |
| Jul 1 |
213 |
$1,673/sf |
70 |
35 |
| Jul 8 |
212 |
$1,674/sf |
72 |
29 |
| Jul 15 |
217 |
$1,637/sf |
73 |
26 |
| Jul 22 |
218 |
$1,633/sf |
77 |
32 |
| Jul 29 |
221 |
$1,626/sf |
80 |
32 |
| Aug 5 |
222 |
$1,627/sf |
83 |
27 |
| Aug 12 |
217 |
$1,624/sf |
81 |
25 |
| Aug 19 |
209 |
$1,633/sf |
83 |
33 |
| Aug 26 |
209 |
$1,617/sf |
85 |
37 |
| Sep 2 |
207 |
$1,623/sf |
82 |
39 |
| Sep 9 |
204 |
$1,662/sf |
85 |
38 |
| Sep 16 |
201 |
$1,658/sf |
86 |
37 |
| Sep 23 |
200 |
$1,668/sf |
87 |
38 |
| Sep 30 |
192 |
$1,638/sf |
89 |
42 |
| Oct 7 |
189 |
$1,619/sf |
90 |
44 |
| Oct 14 |
194 |
$1,614/sf |
88 |
39 |
| Oct 21 |
186 |
$1,624/sf |
94 |
34 |
| Oct 28 |
190 |
$1,677/sf |
95 |
30 |
| Nov 4 |
193 |
$1,685/sf |
95 |
26 |
| Nov 11 |
192 |
$1,725/sf |
93 |
27 |
| Nov 18 |
197 |
$1,777/sf |
91 |
28 |
| Nov 25 |
189 |
$1,766/sf |
94 |
26 |
| Dec 2 |
188 |
$1,765/sf |
96 |
25 |
| Dec 9 |
187 |
$1,769/sf |
95 |
29 |
| Dec 16 |
185 |
$1,796/sf |
95 |
33 |
| Dec 23 |
174 |
$1,815/sf |
98 |
33 |
| Dec 30 |
169 |
$1,827/sf |
105 |
28 |
NSDCC Weekly New Listings and New Pendings
| Week |
New Listings |
New Pendings |
Total Actives |
Total Pendings |
| Jan 2, 2024 |
18 |
10 |
255 |
113 |
| Jan 8 |
43 |
12 |
278 |
100 |
| Jan 15 |
52 |
20 |
305 |
102 |
| Jan 22 |
50 |
29 |
308 |
122 |
| Jan 29 |
44 |
32 |
314 |
140 |
| Feb 5 |
44 |
33 |
312 |
149 |
| Feb 12 |
37 |
34 |
292 |
159 |
| Feb 19 |
53 |
24 |
326 |
143 |
| Feb 26 |
45 |
37 |
324 |
151 |
| Mar 4 |
52 |
45 |
332 |
166 |
| Mar 11 |
53 |
26 |
331 |
165 |
| Mar 18 |
62 |
32 |
355 |
159 |
| Mar 25 |
45 |
46 |
348 |
186 |
| Apr 1 |
37 |
42 |
340 |
183 |
| Apr 8 |
58 |
36 |
352 |
191 |
| Apr 15 |
58 |
29 |
378 |
184 |
| Apr 22 |
44 |
36 |
384 |
179 |
| Apr 29 |
67 |
36 |
393 |
185 |
| May 6 |
58 |
48 |
394 |
183 |
| May 13 |
47 |
34 |
395 |
186 |
| May 20 |
67 |
26 |
429 |
171 |
| May 27 |
57 |
36 |
435 |
179 |
| Jun 3 |
55 |
26 |
449 |
166 |
| Jun 10 |
77 |
40 |
469 |
175 |
| Jun 17 |
64 |
37 |
474 |
175 |
| Jun 24 |
78 |
29 |
489 |
192 |
| Jul 1 |
51 |
38 |
496 |
188 |
| Jul 8 |
41 |
37 |
479 |
184 |
| Jul 15 |
52 |
29 |
509 |
172 |
| Jul 22 |
43 |
42 |
495 |
172 |
| Jul 29 |
50 |
23 |
503 |
156 |
| Aug 5 |
52 |
40 |
492 |
148 |
| Aug 12 |
49 |
38 |
489 |
150 |
| Aug 19 |
63 |
29 |
486 |
162 |
| Aug 26 |
56 |
38 |
477 |
167 |
| Sep 2 |
56 |
33 |
465 |
167 |
| Sep 9 |
34 |
27 |
463 |
168 |
| Sep 16 |
53 |
33 |
465 |
163 |
| Sep 23 |
54 |
29 |
475 |
166 |
| Sep 30 |
50 |
39 |
470 |
158 |
| Oct 7 |
45 |
30 |
477 |
160 |
| Oct 14 |
34 |
33 |
471 |
163 |
| Oct 21 |
45 |
28 |
470 |
160 |
| Oct 28 |
44 |
23 |
464 |
147 |
| Nov 4 |
32 |
21 |
466 |
134 |
| Nov 11 |
41 |
20 |
460 |
133 |
| Nov 18 |
43 |
30 |
452 |
144 |
| Nov 25 |
36 |
29 |
398 |
150 |
| Dec 2 |
18 |
18 |
373 |
147 |
| Dec 9 |
45 |
22 |
401 |
141 |
| Dec 16 |
26 |
26 |
386 |
141 |
| Dec 23 |
12 |
25 |
343 |
135 |
| Dec 30 |
12 |
9 |
323 |
125 |
NSDCC List Price Quartiles
| Week |
1st Quartile |
Median List Price |
3rd Quartile |
| Jan 2, 2024 |
$2,549,888 |
$4,444,000 |
$8,350,000 |
| Jan 8 |
$2,572,444 |
$4,447,000 |
$8,097,500 |
| Jan 15 |
$2,499,000 |
$4,200,000 |
$7,950,000 |
| Jan 22 |
$2,429,000 |
$4,250,000 |
$7,450,000 |
| Jan 29 |
$2,399,000 |
$4,225,000 |
$7,495,000 |
| Feb 5 |
$2,398,000 |
$4,272,500 |
$7,495,000 |
| Feb 12 |
$2,499,800 |
$4,297,500 |
$7,495,000 |
| Feb 19 |
$2,499,400 |
$4,200,000 |
$6,972,500 |
| Feb 26 |
$2,649,400 |
$4,350,000 |
$7,300,000 |
| Mar 4 |
$2,525,000 |
$4,225,000 |
$7,149,500 |
| Mar 11 |
$2,649,000 |
$4,295,000 |
$7,495,000 |
| Mar 18 |
$2,500,000 |
$4,000,000 |
$6,750,000 |
| Mar 25 |
$2,680,000 |
$4,097,499 |
$6,750,000 |
| Apr 1 |
$2,785,000 |
$4,150,000 |
$6,999,999 |
| Apr 8 |
$2,680,000 |
$4,047,500 |
$6,999,000 |
| Apr 15 |
$2,570,000 |
$3,899,500 |
$6,797,500 |
| Apr 22 |
$2,499,000 |
$3,982,500 |
$6,495,000 |
| Apr 29 |
$2,399,000 |
$3,990,000 |
$6,750,000 |
| May 6 |
$2,485,000 |
$3,995,000 |
$6,825,000 |
| May 13 |
$2,475,000 |
$3,895,000 |
$6,900,000 |
| May 20 |
$2,420,000 |
$3,750,000 |
$6,480,000 |
| May 27 |
$2,495,000 |
$3,840,000 |
$6,695,000 |
| Jun 3 |
$2,475,000 |
$3,749,000 |
$6,395,000 |
| Jun 10 |
$2,388,000 |
$3,500,000 |
$6,187,000 |
| Jun 17 |
$2,412,500 |
$3,599,500 |
$5,995,000 |
| Jun 24 |
$2,350,000 |
$3,500,000 |
$6,398,000 |
| Jul 1 |
$2,398,000 |
$3,600,000 |
$6,400,000 |
| Jul 8 |
$2,399,000 |
$3,650,000 |
$6,500,000 |
| Jul 15 |
$2,399,999 |
$3,500,000 |
$6,398,000 |
| Jul 22 |
$2,399,000 |
$3,695,000 |
$6,398,000 |
| Jul 29 |
$2,375,000 |
$3,650,000 |
$6,187,000 |
| Aug 5 |
$2,350,000 |
$3,699,500 |
$6,295,000 |
| Aug 12 |
$2,349,000 |
$3,650,000 |
$5,995,000 |
| Aug 19 |
$2,315,000 |
$3,595,000 |
$5,995,000 |
| Aug 26 |
$2,299,999 |
$3,649,000 |
$5,999,000 |
| Sep 2 |
$2,350,000 |
$3,698,000 |
$6,495,000 |
| Sep 9 |
$2,300,000 |
$3,700,000 |
$6,495,000 |
| Sep 16 |
$2,345,000 |
$3,695,000 |
$6,250,000 |
| Sep 23 |
$2,299,000 |
$3,600,000 |
$6,475,000 |
| Sep 30 |
$2,297,000 |
$3,495,000 |
$6,099,000 |
| Oct 7 |
$2,200,000 |
$3,490,000 |
$5,900,000 |
| Oct 14 |
$2,250,000 |
$3,500,000 |
$6,295,000 |
| Oct 21 |
$2,262,500 |
$3,495,000 |
$5,997,000 |
| Oct 28 |
$2,249,000 |
$3,495,000 |
$6,495,000 |
| Nov 4 |
$2,183,500 |
$3,495,000 |
$6,495,000 |
| Nov 11 |
$2,199,000 |
$3,495,000 |
$6,649,000 |
| Nov 18 |
$2,250,000 |
$3,537,500 |
$6,990,000 |
| Nov 25 |
$2,199,500 |
$3,537,500 |
$6,925,000 |
| Dec 2 |
$2,300,000 |
$3,850,000 |
$7,150,000 |
| Dec 9 |
$2,300,000 |
$3,880,000 |
$6,995,000 |
| Dec 16 |
$2,498,500 |
$3,895,000 |
$7,424,500 |
| Dec 23 |
$2,499,900 |
$4,150,000 |
$7,349,000 |
| Dec 30 |
$2,500,000 |
$4,250,000 |
$7,499,900 |


11. Last year at this time, interest rates were around 6.5 % trending downward after reaching a peak of around 8% in October 2023. This year, they are around 7% trending upward after reaching a low point of around 6.25% in late September.
Thanks Maryam!
You might be starting a new category.
My ten reasons are generic, organic reasons why more sellers will be listing their homes for sale this year. Probably 20% more than last year.
Your thought is in a different grouping – those sellers who are reacting to the new market conditions, and are selling while they can get out with about what they could get last year.
A third category, Panic Sellers, won’t form until there is already blood in the water (an obvious -10% in pricing). It will be a very small group.
The National Association of Realtors (NAR) releases monthly reports on both existing and pending home sales. The latter tracks signed purchase contracts that have not yet closed. As such, it’s seen as a good early indicator of existing home sales in the following month.
The housing market would take any help it can get at the moment and November’s pending sales numbers are actually legitimately encouraging, even if the overall level of activity remains historically low.
This is the 4th consecutive month of improvement for the index and it brings it to the highest level since February 2023. Contract signings were up 2.2% versus last month and 6.9% versus last year, even as mortgage rates remain elevated. That makes the past few months significant because this the first meaningful break into positive year-over-year territory since early 2022.
“Consumers appeared to have recalibrated expectations regarding mortgage rates and are taking advantage of more available inventory,” said NAR Chief Economist Lawrence Yun. “Mortgage rates have averaged above 6% for the past 24 months. Buyers are no longer waiting for or expecting mortgage rates to fall substantially. Furthermore, buyers are in a better position to negotiate as the market shifts away from a seller’s market.”
Regionally, the South led the charge with a 5.2% increase vs last month. The Midwest and Western regions advanced less than 1% and the Northeast declined 1.3%. All 4 regions are stronger in year over year terms.
https://www.mortgagenewsdaily.com/news/12302024-pending-home-sales
Is 2025 the year flippers will poop the bed? Flippers eventually get caught. This game has gone on too long with such low risk. Buying a tired property and putting in a cheap kitchen and cheap Glacier Bay bathroom is almost over.
So, if inventory is going up will there be buyers? This is the million dollar question.
If inventory stays high for an extended amount of time will banks start doing short sales again to incentivize sales? Or will banks let people live in houses for free and not foreclose? (To maintain high prices)
My bet is inventory will continue to expand and the buyer pool will get more and more picky. I don’t think prices will go down that much. Unless banks start foreclosing again.
So, if inventory is going up will there be buyers? This is the million dollar question.
I think there will be lookers….will they be more cautious when they see additional homes for sale? Especially if there is a flood? I think so.
I don’t think the average person understands what’s going on with the job market.
Unemployment, and underemployment are significantly higher than reported. Most of the big businesses in California are hiring outside of the state, or overseas.
The days of the 400k tech job are over, and AI is starting to really eliminate entire swaths of jobs.
Ultra rich / Cash buyers – can they sustain this?
Ultra rich / Cash buyers – can they sustain this?
Yes, I think they can.
The generational wealth transfer will continue for years, and when the money comes (too) easy, it gets spent easily too (IOW, buyers don’t care as much about price).