

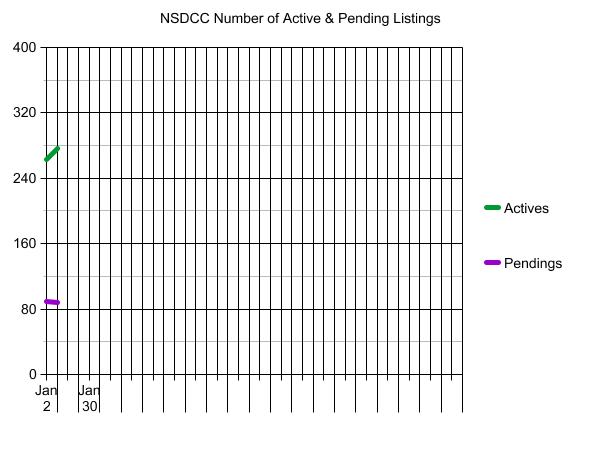
There are only 88 pending listings today, which means we are unlikely to get up to 100 sales between La Jolla and Carlsbad this month.
How radically different is that? Here’s how this month will compare to the previous Januarys of interest:
NSDCC Detached-Home January Sales & Listings
| January Year | ||
| 2009 | ||
| 2019 | ||
| 2022 | ||
| 2023 – projected |
Discard all previous assumptions, and prepare for market conditions that we have never seen before.
I might leave this fact on every blog post this year, because it probably matters most:
There are over 76 million American baby boomers. All will be 65 years or older….IN EIGHT YEARS.
The $0 – $1,500,000 Market:
| Date | ||||
| Jan 2, 2023 | ||||
| Jan 9 |
The $1,500,000 – $2,000,000 Market:
| Date | ||||
| Jan 2, 2023 | ||||
| Jan 9 |
The $2,000,000 – $3,000,000 Market:
| Date | ||||
| Jan 2, 2023 | ||||
| Jan 9 |
The $3,000,000 – $4,000,000 Market:
| Date | ||||
| Jan 2, 2023 | ||||
| Jan 9 |
The $4,000,000+ Market:
| Date | ||||
| Jan 2, 2023 | ||||
| Jan 9 |
NSDCC Weekly New Listings and New Pendings
| Week | ||||
| Jan 2, 2023 | ||||
| Jan 9 |
For previous years, click here:


In January, 2008 we had 458 new listings – the exact same number as in 2009 – and 115 sales.
There was a hot scramble to get out while banks were tanking the market.
Today we have neither a hot scramble or banks dumping properties.
I see 5 potential outcomes over the next year.
1. Banks start Foreclosing. Not a high possibility but what should be happening.
2. Old people die off and young people sell the inherited properties.
3. Gov starts giving builders $$$ to compensate for higher interest rates.
4. Gov starts giving buyers $$$ to compensate for higher interest rates.
5. Nothing and number of sales stays low.
With the way politics are going right now my bet is that #3 or #4 start happening. Gov money is being handed out like candy. Again foreclosing is what should be happening but its messy + no matter how it’s done someone is unhappy. Giving out $$$ is much easier + kicks the can for the next politician to deal with.
5. Nothing and number of sales stays low.
Bet the farm on this one.
Unless they tackle the onerous capital-gains tax (especially in the eyes of the longtime owners), inventory isn’t going to loosen up. It was a problem when rates were 3%.