

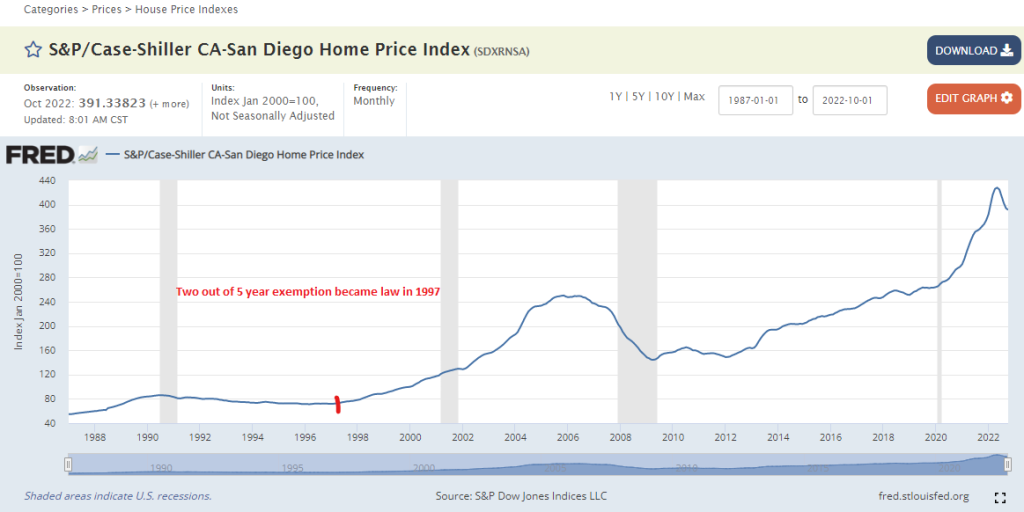
The local index peaked in May, so today’s local Case-Shiller reading for October is the fourth in a row that reflects the much-higher mortgage rates:
San Diego Non-Seasonally-Adjusted CSI changes
| Observation Month | |||
| Jan ’21 | |||
| Feb | |||
| Mar | |||
| Apr | |||
| May | |||
| Jun | |||
| Jul | |||
| Aug | |||
| Sep | |||
| Oct | |||
| Nov | |||
| Dec | |||
| Jan ’22 | |||
| Feb | |||
| Mar | |||
| Apr | |||
| May | |||
| Jun | |||
| Jul | |||
| Aug | |||
| Sep | |||
| Oct |
It looks like we may have seen the worst of it?
If so, and the monthly declines are tempered over the next couple of readings, it should mean that the index will be in the 380-390 range as we roll into the spring selling season – or about where it was a year ago.
It sure seems to be going better than most people thought it would!


https://www.wsj.com/articles/housing-slump-set-to-give-fed-an-inflation-fighting-assist-11671915427
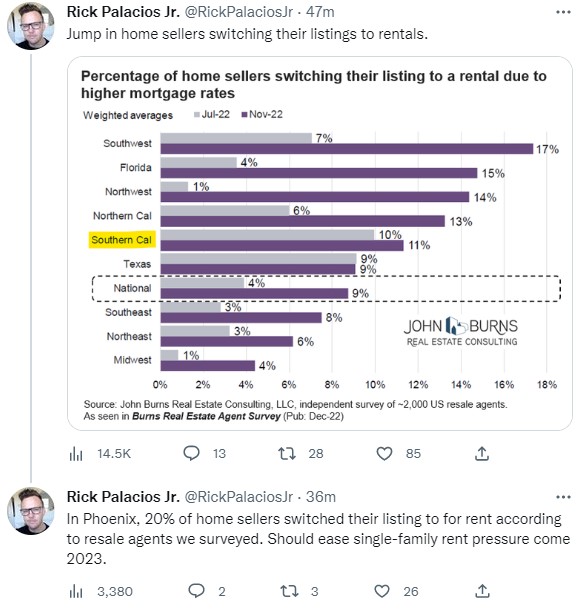
Buyers have retreated to the sidelines, while sellers who have locked in a low interest rate have less reason to sell.
Sales of existing homes fell in November for a record 10th straight month. Economists at Fannie Mae and Goldman Sachs forecast they will drop below 4 million in 2023, lower than during the 2006-11 housing bust.
The Fed is stuck with OER as a housing component and that is on full burn higher for at least 3 more quarters.
Fearless prediction. OER calculations will be “adjusted.”
“better than most people thought it would”…
I don’t know, Jim, a whole lotta people have been in total denial and thought NCSDCC would never fall again. Heck, plenty still do.
I don’t know, Jim, a whole lotta people have been in total denial and thought NCSDCC would never fall again. Heck, plenty still do.
Agree, and I’ll suggest that the majority couldn’t care less. They are going to live it out and let the kids deal with it later.
As we segue to an estate-sale marketplace, we could see a gradual decline in values just because the kids want to cash-and-run – and agents just want to churn.
The youngest boomers won’t hit retirement until 2030, and most of them will probably live another 20 years or so after that. How long will it be before that estate-sale marketplace takes hold, and will there be a retirement-sale marketplace for a while before that happens?