

Are we going to get a surge of new listings in the coming months?
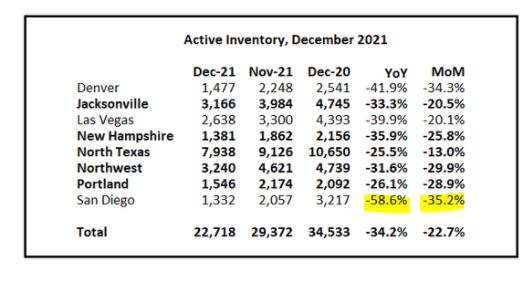
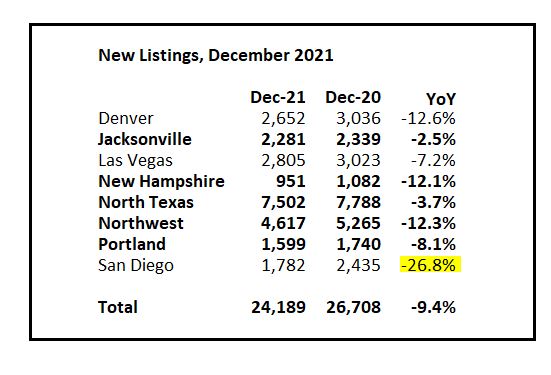
Our recent history doesn’t suggest it – the San Diego inventory has been the worst around (thanks Bill):
But let’s consider what used to be normal, and see if we can connect the dots.
NSDCC Number of Listings Between January 1st and June 30th:
| Year | |
| 2017 | |
| 2018 | |
| 2019 | |
| 2020 | |
| 2021 |
The first-half inventory really hit a groove at 2,700 listings for three years straight. But then the impact from covid struck in 2020, and the listings count was 15% lower than the previous years.
But then 2021 was even worse!
If you remember last year, we did a contest for readers to guess the number of listings in January, and everyone came in much higher than the actual listing count. The final total was 288 (Derek did get tickets).
As it turned out, it was an omen for the inventory all year.
Let’s do it again! To keep an eye on what will be the #1 predictor on how the spring season will roll out, let’s guess the number of NSDCC listings this month!
The recent history is below – leave your guess in the comment section.
NSDCC Total Number of Listings, Jan 1-31
| Year | |
| 2017 | |
| 2018 | |
| 2019 | |
| 2020 | |
| 2021 |
If there is a baseball season, the winner will get four tickets to a Padres game! They aren’t front row, but they are pretty good seats:

There may only be a dozen or so guesses, so take part – your chances of winning are good!
My general sense of what will happen, based on the number of January listings:
450 or more listings: Frenzy will be over within 30 days.
400-450 listings: Causes a wait-and-see with some buyers.
300-400 listings: Super-charges the environment to ultra-frenzy conditions!
Under 300 listings: Painfully slow opening to the selling season.
Give it a guess!


Not all transactions will make it to the listings. I’ll guess 295 but as a past occupant of those great seats I should not be eligible. Oh, and don’t be a sneaky contestant no guesses of 298 or 300. Leave everyone a little room!
300!
181 new listings!
215 listings. Omicron coupled with higher interest rates will have people wait it out.
294 🙂
373
Seats are fantastic! Let’s make it two years in a row – 260 listings.
B-well didn’t see your request, R-dawg, because I wasn’t approving the comments fast enough. Maybe he/she will reconsider?
Omicron coupled with higher interest rates will have people wait it out.
Omicron maybe but smart sellers will want to get ahead of rate hikes. Goldman Sachs thinks the Fed will move earlier that expected and in March do their first hike.
Mortgage market already pricing it in too. Today’s conforming rate up to 3 5/8 no points.
https://www.reuters.com/markets/funds/goldman-sachs-expects-four-fed-rate-hikes-this-year-2022-01-10/
270!
142 ultra low listings
286
259 [Go Dodgers!] 🙂
142 ultra low listings
The other Bob, you are killing me! At that rate, I’ll be doing clutches and transmissions by summer!
That’s Kershaw pitching to Tatis in the photo!
230 … all about Omicron and bear stock market
201
From today’s UT:
Higher mortgage rates may not scare off buyers in S.D. Highly competitive market unlikely to cool down soon, real estate analysts say.
Higher mortgage rates might not slow the real estate market as much as one might think, according to a new study from Redfin, especially in competitive markets like San Diego.
The Seattle company’s survey of house hunters found that 47 percent would feel an urgency to buy a home if rates rose above 3.5 percent to avoid waiting for them to rise even more.
The study ran from Dec. 10 to Dec. 13, 2021, and included 1,500 people across the U.S. planning to buy or sell a home in the next year.
Not all respondents said they would feel an urgency to buy if rates rose. Around 29 percent said they would look in another area or seek a smaller home; 14 percent would wait for rates to drop, or just slow their search; 7 percent said there would be no impact; and 2 percent said they would cancel homebuying plans if rates passed 3.5 percent.
The competitive environment means mortgage rates are not always the top concern for buyers, said Jason Cassity, a San Diego real estate agent with Compass.
“Mortgage rates probably should be (a topic) more than it is,” he said of conversations with buyers, “but over the last six months or so, people are a bit desensitized by the interest rates.” Cassity said interest rate increases can affect buyers’ purchasing power, but rates aren’t rising enough to make a big difference. He said that if rates rise above 4 percent to 4.5 percent, that’s when the local market might see a slowdown.
237. Wow lots of variables!
Yep.
Here’s one for you. What if they cancel the season?
Or can’t get rid of Hosmer?
Last years winner of 288 -15%
Lets go with 245!
Season w/o Hosmer and Pham would be fine
> At that rate, I’ll be doing clutches and transmissions by summer!
I remember how good you are with parking brakes. 😉
From Rick P via Bill:
#Atlanta builder: “Have virtually no available inventory & huge backlog of 1,000+ units going in to 2022. Still metering sales in most communities, where the demand of waiting buyers still outnumbers our supply.”
#LasVegas builder: “Busiest orders for December I can remember in a long time.”
#Charlotte builder: “Haven’t seen this hot of a new homebuilding market in 27 years in Charlotte. Reminds me of the go-go days in the late 1980’s right before the S & L’s (Savings & Loan Crisis) rocked my new homebuilding world in Southern California.”
#Oakland builder: “Still selling out of every phase as soon as we release homes for sale.”
#SanDiego builder: “There hasn’t been an elevating-cost environment like this for ~40 years. Anyone who says otherwise is delusional. If home price increases were less it would be brutal.”
#SanAntonio builder: “Framers are accepting jobs & then demanding more money to actually do the job or they walk. Concrete delivery causing delays in scheduling pours due to lack of drivers. COVID seems to be causing short term labor issues throughout our contractor base.”
#Jacksonville builder: “Costs are through the roof!”
#Orlando builder: “Shortage of materials & labor in almost every trade. No negotiation on bids.”
#Tampa builder: “Debt-to-income ratios are getting out of line for even the above average family to afford new construction. Trade base is stressed beyond max. Quality of construction is what keeps me up at night.”
#Sarasota builder: “Continue to see lumber price increases, appliances on backorder, & HVAC units/systems delayed.”
#Chicago builder: “Garage doors have tripled in cost & lead time is 24 weeks.”
#Stockton builder: “All trades are looking to pass along wage increases. Most product manufacturers are announcing material increases of 5-10% in the new year.”
#WashingtonDC builder: “We’re at the point where we can no longer offset cost increases with price increases.”
#Boston builder: “With a 1-year backlog, we’ve proceeded cautiously to allow time between releases for price increase purposes.”
#Bend builder: “Don’t list homes until nearly complete due to volatile materials market & availability. Production has slowed immensely due to lack of hardware (garage doors or cabinet doors, paint, lumber, appliances, HVAC items).”
#RiversideSanBernardino builder: “National builders are buying & warehousing supplies, which strains available product. Everything is on a boat in harbor with no estimate of timing. GE representatives are getting harder to get a hold of. Garage door costs have roughly doubled.”
#RaleighDurham builder: “Expect YOY cost increases to be the same in 2022 that we saw in 2021.”
#Wilmington builder: “Supply chain is still disruptive, delaying offering homes for sale.”
#Knoxville builder: “Costs were already spiraling, then most subcontractors & vendors raised them again effective 1/1/22. No cost pressure relief in sight.”
#Tucson builder: “Windows are being significantly delayed. Brick pavers are hard to find.”
#Austin builder: “Lumber is expected to go back up significantly this year. Being told factories are still not operating at capacity & tariffs aren’t allowing solid competition to provide relief.”
#FortWorth builder: “Lumber pricing ready to skyrocket in January. Looking like a repeat of 2021.”
#Houston builder: “Build cycle time increases in all areas (engineering, entitlements, development, permitting, home construction, inspections, etc.) will likely have impacts in early 2022 until supply chain & labor availability stabilizes.”
#Dallas builder: “Consistent cost increases as well as supply issues creating a challenge getting our backlog built & causing margin erosion. Expecting lumber to hit above 2021 pricing.”
#ColoradoSprings builder: “Costs are still rising & ability to pass along increases to buyers is likely going away. Expect gross margins to decrease in the 2nd half of 2022 & in 2023.”
#Phoenix builder: “Margin pressure is getting difficult.”
I remember how good you are with parking brakes. ????
I gotta find that photo!
250 is my guess
312 sounds about right.
My thought of the day:
In spite of rates increasing a half-point already, it appears that the frenzy momentum will continue for a while.
If the value of your home was +10% by May/June, would you sell then? Because you want to prepare now and be ready to list on May 1st.
You don’t want to have the realization too late that the +10% happened, and then start the scramble to get ready/find a place to move/have Jim sell house. It won’t be the same market in September.
325!
Sellers are pushed off the fence due to the rising interest rates and want to sell before the affordability issues hits the market.
278
So far:
142 The other Bob
181 Eddie89
201 Daniel Nicolas
215 Joe
230 Lifeisradincbad (who was a winner last year)
237 Curtis Kaiser
245 doughboy
250 Deckard Mehdy
259 Susie
260 Derek (the other winner last year and only missed by 1)
270 Skip
278 Haile
286 Matt
294 Tom
295 Rob Dawg
300 BWell_SoCal
312 big T
325 Mortgage Guy
373 Rob
19 guesses so far – thanks for playing!
260 is the median
Last year there were 99 in the first 11 days, and this year there have been 56 – though there are some not uploaded yet so maybe 65-70 in the end.
Missing my 215 guess 🙂
Added, though I had in the count already so median is the same.
We’ll take additional guesses for a few more days – smart to pick the gaps and give yourself some room.
Late to the party, lets say 150. Something has got to give, we can’t all have diamond hands!!
Been out of country for a few months visiting family and just got back. Sorry but I’m gonna go low end. 135. No one in this country wants to work or move anymore. I don’t either
290
So far:
142 The other Bob
181 Eddie89
201 Daniel Nicolas
210 Drew
215 Joe
222 Majeed
230 Lifeisradincbad (who was a winner last year)
237 Curtis Kaiser
245 doughboy
250 Deckard Mehdy
259 Susie
260 Derek (the other winner last year and only missed by 1)
270 Skip
278 Haile
286 Matt
290 Esteban del Rio
294 Tom
295 Rob Dawg
300 BWell_SoCal
312 big T
325 Mortgage Guy
373 Rob
NSDCC is up to 63 listings YTD as of this morning. We need the ‘cron to clear up quick!
222
210
Ok, we have our guesses. The contest is set.
As of today, there have been 84 new NSDSCC listings.