

What a difference compared to the second half of 2019:
San Diego Non-Seasonally-Adjusted CSI changes:
| Observation Month | |||
| January ’19 | |||
| Feb | |||
| Mar | |||
| Apr | |||
| May | |||
| June | |||
| July | |||
| Aug | |||
| Sep | |||
| Oct | |||
| Nov | |||
| Dec | |||
| Jan ’20 | |||
| Feb | |||
| Mar | |||
| Apr | |||
| May | |||
| June | |||
| July | |||
| Aug | |||
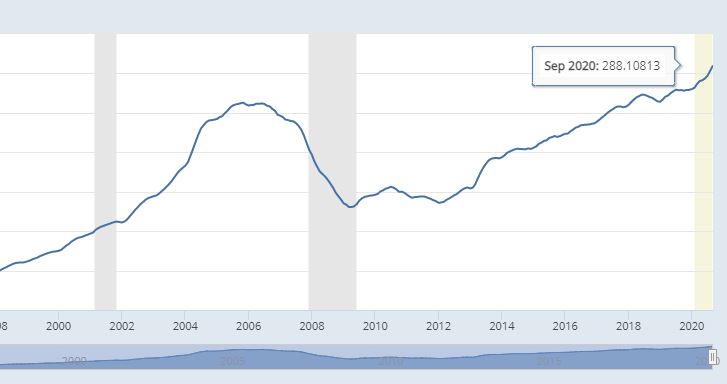
| Sep |
If we can sustain the monthly 1.8% increase x 12 = 21.6%.
From cnbc:
This index is a three-month running average, so it represents prices from July through September, when buyers were eagerly seeking homes with more space for working and schooling at home due to the coronavirus.
“Housing prices were notably – I am tempted to say ‘very’ – strong in September,” said Craig J. Lazzara, managing director and global head of index investment strategy at S&P Dow Jones Indices. “This month’s increase may reflect a catch-up of COVID-depressed demand from earlier this year; it might also presage future strength, as COVID encourages potential buyers to move from urban apartments to suburban homes. The next several months’ reports should help to shed light on this question.”
Phoenix, Seattle and San Diego continued to see the highest annual gains among the 19 cities (excluding Detroit) in September. Home prices in Phoenix rose 11.4% year over year, followed by Seattle with a 10.1% increase and San Diego with a 9.5% increase.
https://www.cnbc.com/2020/11/24/home-prices-see-biggest-spike-in-6-years-in-september.html
~~~~~~~~~~~~~~~~~~~~~~~~~~~~~~~~~~~~~~~~~


0 Comments