

Rates are really low, and the market is responding. We’ve considered it a balanced market when the active listings are running about twice the number of pendings. Here’s how we’re doing so far in 2020, and compared to last February:
NSDCC Detached-Home Active and Pending Listings:
| Area | |||||
| Cardiff | |||||
| Carlsbad NW | |||||
| Carlsbad SE | |||||
| Carlsbad NE | |||||
| Carlsbad SW | |||||
| Del Mar | |||||
| Encinitas | |||||
| La Jolla | |||||
| RSF | |||||
| Solana Bch | |||||
| Carmel Vly | |||||
| All Above |
We are at the 2.0 mark, but take out La Jolla and Rancho Santa Fe and we’re at 1.3!
In SE Carlsbad and Carmel Valley – which are about the same size – we have more pendings than actives!


Pending home sales in January rose 5.2%, the National Association of Realtors said Thursday, crushing analysts’ expectations of a 2% monthly gain. They were 5.7% higher on an annual basis.
“This month’s solid activity — the second-highest monthly figure in over two years — is due to the good economic backdrop and exceptionally low mortgage rates,” said Lawrence Yun, NAR’s chief economist.
https://www.cnbc.com/2020/02/27/january-pending-home-sales-jump-more-than-expected-up-5point2percent.html
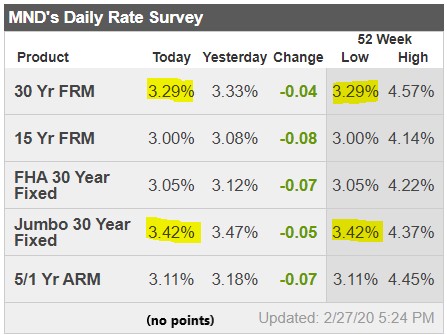
Mortgage rates hit the lowest levels in 8 years either today or yesterday, depending on the lender, just narrowly edging out the rates seen in early July 2016. There are multiple caveats, however. First off, lenders are responding to recent market movements in different ways. Some lenders move down faster and then remain flat even as the bond market (which dictates rates) improves. Other lenders have been slow to react, but have since moved down more steadily. Still others are somewhere between those extremes.
Perhaps the most important thing to note about mortgage rates this week is that, while they are certainly at long-term lows, they are absolutely NOT moving lower as fast or as much as US Treasury yields.