

NSDCC Actives and Pendings
We looked at the somewhat-gloomy San Diego County stats, so let’s also examine the individual areas around the north county coastal region.
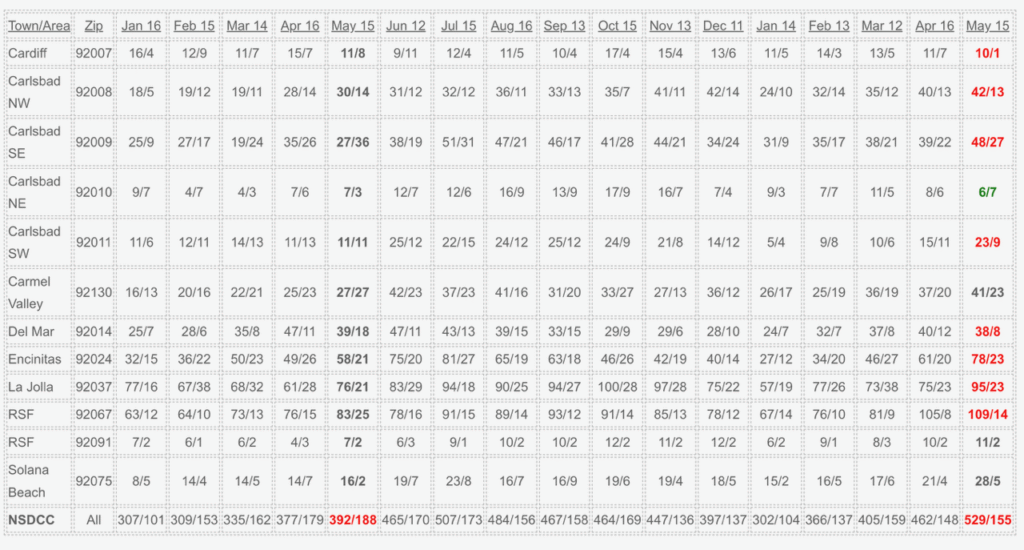
Comparing year-over-year, it looks a little gloomy here too.
The areas in red have worse numbers (more actives and/or fewer pendings) than on May 15th of last year…..and only one area in green, which is the least-expensive area on the chart.
The SE Carlsbad and Carmel Valley numbers aren’t as hot as they were last year, but both have better than the 2:1 ratio of actives-to-pendings so they will be fine.
Encinitas and La Jolla have 20 and 19 more actives than last year, but their pendings counts are about the same. Encinitas is huge, physically (20 square miles) and La Jolla doesn’t have for-sale signs so it’s doubtful anyone will notice 20 extra actives laying around.
Rancho looks alarming but they don’t care what we think – they will wait it out.
Today there are 35% more actives and 18% fewer pendings, year-over-year.
This is the surge I was talking about last year:
First blog post about a 2025 inventory surge from October 22nd:
https://www.bubbleinfo.com/
I issued a red alert on October 29th:
https://www.bubbleinfo.com/
By December 13th, I was up to ten reasons why the 2025 inventory was going to surge:
https://www.bubbleinfo.com/
Not bragging, just noting that the market conditions are predictable – and anyone who is paying attention could have called it.
Here’s another prediction. It going to get harder to sell your house. Get Good Help!


0 Comments