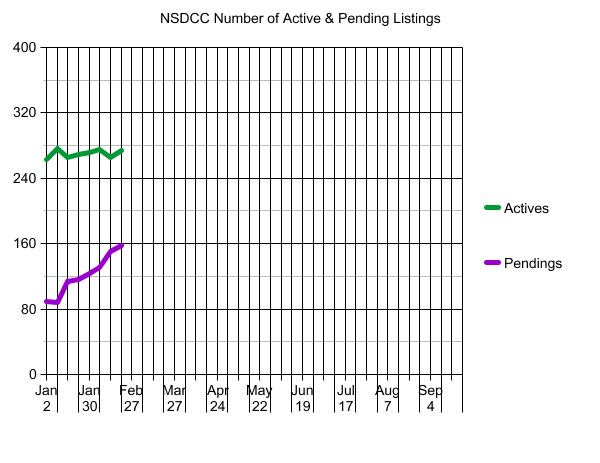
As you can tell in the graph above, there hasn’t been a flood of inventory (yet), and the number of pendings is rising steadily. All of the frenzy conditions are in place this year, just like they were since the pandemic broke out and inventory plunged.
The casual observers will struggle to notice, however.
With so few homes for sale, it won’t be as obvious how hot the market is…or could be!
NSDCC Number of Listings Between Jan 1 and Feb 15
| Year |
Number of Listings |
Median List Price |
| 2019 |
625 |
$1,650,000 |
| 2020 |
563 |
$1,790,000 |
| 2021 |
449 |
$1,898,000 |
| 2022 |
341 |
$2,575,000 |
| 2023 |
278 |
$2,699,000 |
When is the best time to sell? When no one else is!
The $0 – $1,500,000 Market:
| Date |
NSDCC Active Listings |
Avg. LP/sf |
Avg. DOM |
# of Pendings |
| Jan 2, 2023 |
22 |
$719/sf |
75 |
15 |
| Jan 9 |
26 |
$687/sf |
50 |
14 |
| Jan 16 |
23 |
$701/sf |
52 |
20 |
| Jan 23 |
25 |
$751/sf |
60 |
21 |
| Jan 30 |
23 |
$788/sf |
45 |
25 |
| Feb 6 |
18 |
$750/sf |
59 |
24 |
| Feb 13 |
18 |
$770/sf |
48 |
26 |
| Feb 20 |
17 |
$778/sf |
49 |
26 |
The $1,500,000 – $2,000,000 Market:
| Date |
NSDCC Active Listings |
Avg. LP/sf |
Avg. DOM |
# of Pendings |
| Jan 2, 2023 |
45 |
$809/sf |
60 |
18 |
| Jan 9 |
55 |
$828/sf |
53 |
19 |
| Jan 16 |
46 |
$838/sf |
53 |
30 |
| Jan 23 |
43 |
$793/sf |
52 |
31 |
| Jan 30 |
40 |
$778/sf |
54 |
34 |
| Feb 6 |
42 |
$814/sf |
46 |
30 |
| Feb 13 |
35 |
$823/sf |
51 |
39 |
| Feb 20 |
34 |
$801/sf |
47 |
40 |
The $2,000,000 – $3,000,000 Market:
| Date |
NSDCC Active Listings |
Avg. LP/sf |
Avg. DOM |
# of Pendings |
| Jan 2, 2023 |
52 |
$869/sf |
69 |
30 |
| Jan 9 |
57 |
$940/sf |
66 |
31 |
| Jan 16 |
50 |
$948/sf |
61 |
36 |
| Jan 23 |
51 |
$949/sf |
58 |
35 |
| Jan 30 |
54 |
$964/sf |
55 |
34 |
| Feb 6 |
60 |
$930/sf |
51 |
42 |
| Feb 13 |
51 |
$1,038/sf |
52 |
47 |
| Feb 20 |
58 |
$1,022/sf |
47 |
46 |
The $3,000,000 – $4,000,000 Market:
| Date |
NSDCC Active Listings |
Avg. LP/sf |
Avg. DOM |
# of Pendings |
| Jan 2, 2023 |
29 |
$1,236/sf |
85 |
6 |
| Jan 9 |
29 |
$1,180/sf |
80 |
5 |
| Jan 16 |
31 |
$1,196/sf |
73 |
8 |
| Jan 23 |
33 |
$1,201/sf |
71 |
7 |
| Jan 30 |
37 |
$1,218/sf |
70 |
6 |
| Feb 6 |
34 |
$1,236/sf |
75 |
12 |
| Feb 13 |
43 |
$1,333/sf |
68 |
11 |
| Feb 20 |
39 |
$1,392/sf |
71 |
18 |
The $4,000,000+ Market:
| Date |
NSDCC Active Listings |
Avg. LP/sf |
Avg. DOM |
# of Pendings |
| Jan 2, 2023 |
121 |
$1,744/sf |
126 |
21 |
| Jan 9 |
119 |
$1,716/sf |
123 |
20 |
| Jan 16 |
120 |
$1,761/sf |
121 |
26 |
| Jan 23 |
122 |
$1,707/sf |
119 |
27 |
| Jan 30 |
120 |
$1,680/sf |
121 |
30 |
| Feb 6 |
125 |
$1,714/sf |
118 |
28 |
| Feb 13 |
121 |
$1,750/sf |
116 |
32 |
| Feb 20 |
129 |
$1,725/sf |
112 |
33 |
NSDCC Weekly New Listings and New Pendings
| Week |
New Listings |
New Pendings |
Total Actives |
Total Pendings |
| Jan 2, 2023 |
11 |
6 |
263 |
89 |
| Jan 9 |
36 |
15 |
277 |
88 |
| Jan 16 |
36 |
34 |
266 |
114 |
| Jan 23 |
36 |
22 |
269 |
116 |
| Jan 30 |
32 |
25 |
272 |
123 |
| Feb 6 |
46 |
33 |
275 |
131 |
| Feb 13 |
30 |
35 |
265 |
150 |
| Feb 20 |
43 |
34 |
274 |
158 |
NSDCC Weekly LP Quartiles
| Week |
1st Quartile |
2nd Quartile (Median LP) |
3rd Quartile |
| Jan 2, 2023 |
$2,095,000 |
$3,695,000 |
$5,995,000 |
| Jan 9 |
$1,990,000 |
$3,495,000 |
$5,775,000 |
| Jan 16 |
$2,000,000 |
$3,574,000 |
$5,995,000 |
| Jan 23 |
$2,099,000 |
$3,595,000 |
$5,999,000 |
| Jan 30 |
$2,195,000 |
$3,525,000 |
$5,942,000 |
| Feb 6 |
$2,195,000 |
$3,598,000 |
$6,845,000 |
| Feb 13 |
$2,300,000 |
$3,795,000 |
$6,495,000 |
| Feb 20 |
$2,397,500 |
$3,950,000 |
$6,197,500 |


Zillow and Redfin both reported Q4 2022 earnings last week. It was a picture of divergent fortunes.
Zillow’s core business was down about 20 percent year-over-year, but remains profitable. When you consider that the Fed effectively stun-gunned the market a third of the way through the year, 20 percent looks pretty damn good. The Opendoor partnership launched in three markets (seller leads!), the apartments business is showing signs of life after being flummoxed by Costar’s Apartments.com a few years back, the Showingtime acquisition is being put to work levering up Premier Agent margins and a product for listing agents is coming together.
In other words, we think they’re doing well.
Redfin, on the other hand, lost a lot of money, lost market share and continues to struggle with its acquisition of a rental business in 2021 and a mortgage business in 2022. The company expects to lose between $116 and $105 million in Q1 of 2023, which is about 45 percent of its total cash on hand. Moreover, the company is having to make hard philosophical concessions, indicating that it will increase its reliance on non-Redfin agents in order to improve gross margins.
In response to an analyst’s question on this point, CEO Glenn Kelman actually said “So last year, we just asked ourselves, is it more expensive to employ agents than we realize?”