

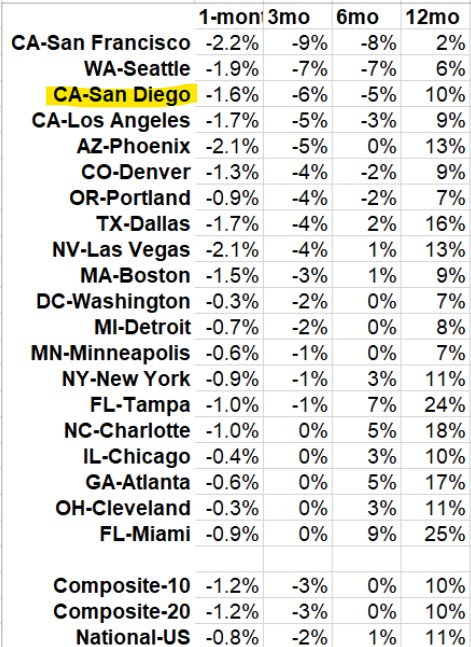
These must be the seasonally-adjusted numbers.
How the mainstream media is reporting today’s Case-Shiller numbers:
- U.S. single-family home prices slowed further in September as higher mortgage rates eroded demand.
- Monthly house prices fell in July for the first time since late 2018.
- The housing market has been hammered by aggressive Federal Reserve interest rate hikes that are aimed at curbing high inflation by dampening demand in the economy.
How it could/should be reported:
- Higher rates are causing buyers AND sellers to wait-and-see.
- Inventory is expected to be lower than ever in 2023.
- Realtors aren’t offering viable solutions.
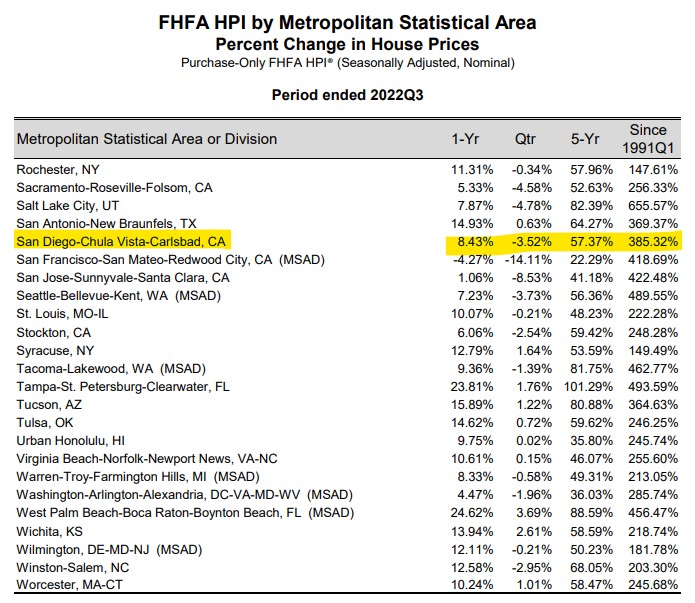
A guy on twitter said that the real story is that YoY appreciation is still positive, which should make the vast majority of American homeowners happy. But I commented on how the NAR is publishing articles now that ignore/omit the downturn. I think that those of us who are in the business of assisting consumers with their real estate decisions should give accurate advice on how to cope with the current market conditions.
San Diego Non-Seasonally-Adjusted CSI changes
| Observation Month | |||
| Jan ’21 | |||
| Feb | |||
| Mar | |||
| Apr | |||
| May | |||
| Jun | |||
| Jul | |||
| Aug | |||
| Sep | |||
| Oct | |||
| Nov | |||
| Dec | |||
| Jan ’22 | |||
| Feb | |||
| Mar | |||
| Apr | |||
| May | |||
| Jun | |||
| Jul | |||
| Aug | |||
| Sep |
While current homeowners might be relieved to see the big pop in appreciation over time, if they are thinking of moving, they should recalibrate everything they think they know about selling homes.


What are those viable solutions?
Buyers: Lowball listings that have been on the market for months.
Sellers: Wait it out – the selling season will be fruiotful.
Realtors: Do everything possible to create a frenzy-like environment:
1. Make the home look spectacular.
2. Price attractively.
3. Maximize the showings (open-house extravaganza)
4. Conduct open bidding between those who offer.
We have utilized Compass Concierge on every listing this year, which allows the homeowners to access their home equity to complete the improvements they deem necessary. We handle EVERYTHING quickly with our trusted contractors who charge a reasonable rate, and our listings stand out among the pack.
How can you guarantee your house sells this week?
Make it the best buy in your marketplace.
Make it obviously the best buy.
“We have utilized Compass Concierge on every listing this year, which allows the homeowners to access their home equity to complete the improvements they deem necessary. We handle EVERYTHING quickly with our trusted contractors who charge a reasonable rate, and our listings stand out among the pack.”
Highlight this much more. Very good way to make your listings stand out.
Compass should expand this program to those that just want fix up their house. Have homeowners sign a contract that theyll sell with Compass if they sell in the next 15 years or pay a fee. Fee/Commission would go to the agent that signed the homeowner up.
Realtors have all the best builder contacts because they’re working with them day in, day out.
In the beginning, it was just the VC money laying around that got used. But they have switched to a finance company now and Compass pays the finance charge instead of the homeowners.
But if the finance company (Notable) did the first year free and then charged a normal interest rate, there should be lots of takers.