
We hear the term, ‘tight inventory’. What does it mean?
Fewer homes for sale?
Fewer of the lower-priced homes for sale?
Homes selling faster?
The best buys are flying off the market in the first day or two?
NSDCC detached-home statistics for Jan 1st – Aug 15th:
| Year | ||||||
| 2016 | ||||||
| 2017 | ||||||
| 2018 | ||||||
| 2019 | ||||||
| 2020 | ||||||
| 20vs19 |
The average and median Days-On-Market metrics are within the normal range, so generally-speaking, homes aren’t selling faster than before.
We’ve had fewer homes for sale (-12% YoY), but sales are only down 8% which isn’t bad. The drop in sales between 2017 and 2018 was slightly more at 9% so we’ve endured this previously.
The overall volume is only down 0.4% YoY ($3,000,850,233 vs $2,988,471,818) – so those on commission (realtors, lenders, escrow, and title) shouldn’t be too concerned with ‘tight inventory’.
Who should be concerned?
Buyers on the lower-end of every market.
We have eleven NSDCC houses for sale priced under $900,000 (in an area of 300,000 people):
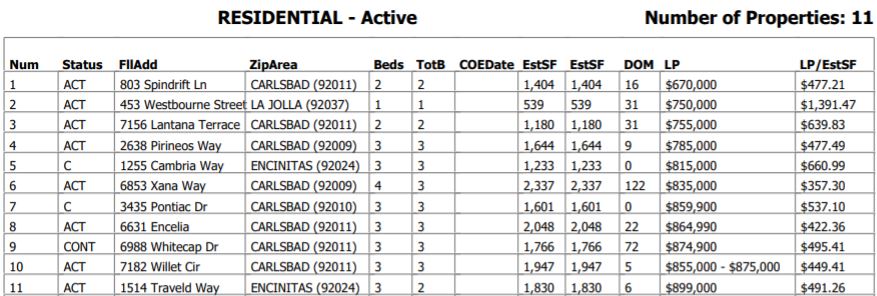
Two of those aren’t on the market yet (coming soon!), and a third has a contingent buyer.
Tight inventory = buyers are getting squeezed up on price.


