

From First American:
In April, pandemic-related pressure drove the supply of homes for sale to its lowest April supply level ever. Even in the years prior to the pandemic, the lack of housing supply for sale was a significant headwind to the housing market. A major reason for the lack of homes for sale is increasing tenure – the length of time a homeowner lives in their home. Since the Great Recession, tenure has rapidly increased from approximately seven years to currently more than 12 years, the highest it has ever been. Increasing tenure means existing homeowners, who supply the overwhelming majority of homes for sale, are not selling, which limits supply.
Prior to the pandemic, rising tenure length was the byproduct of two trends – older homeowners aging in place and many existing homeowners being locked-in with historically low mortgage rates. The pandemic-driven economic uncertainty and concerns about the potential health risks associated with showing homes to buyers have made existing homeowners more hesitant to list their homes for sale, exacerbating the increasing tenure issue.
You Can’t Buy What’s Not for Sale
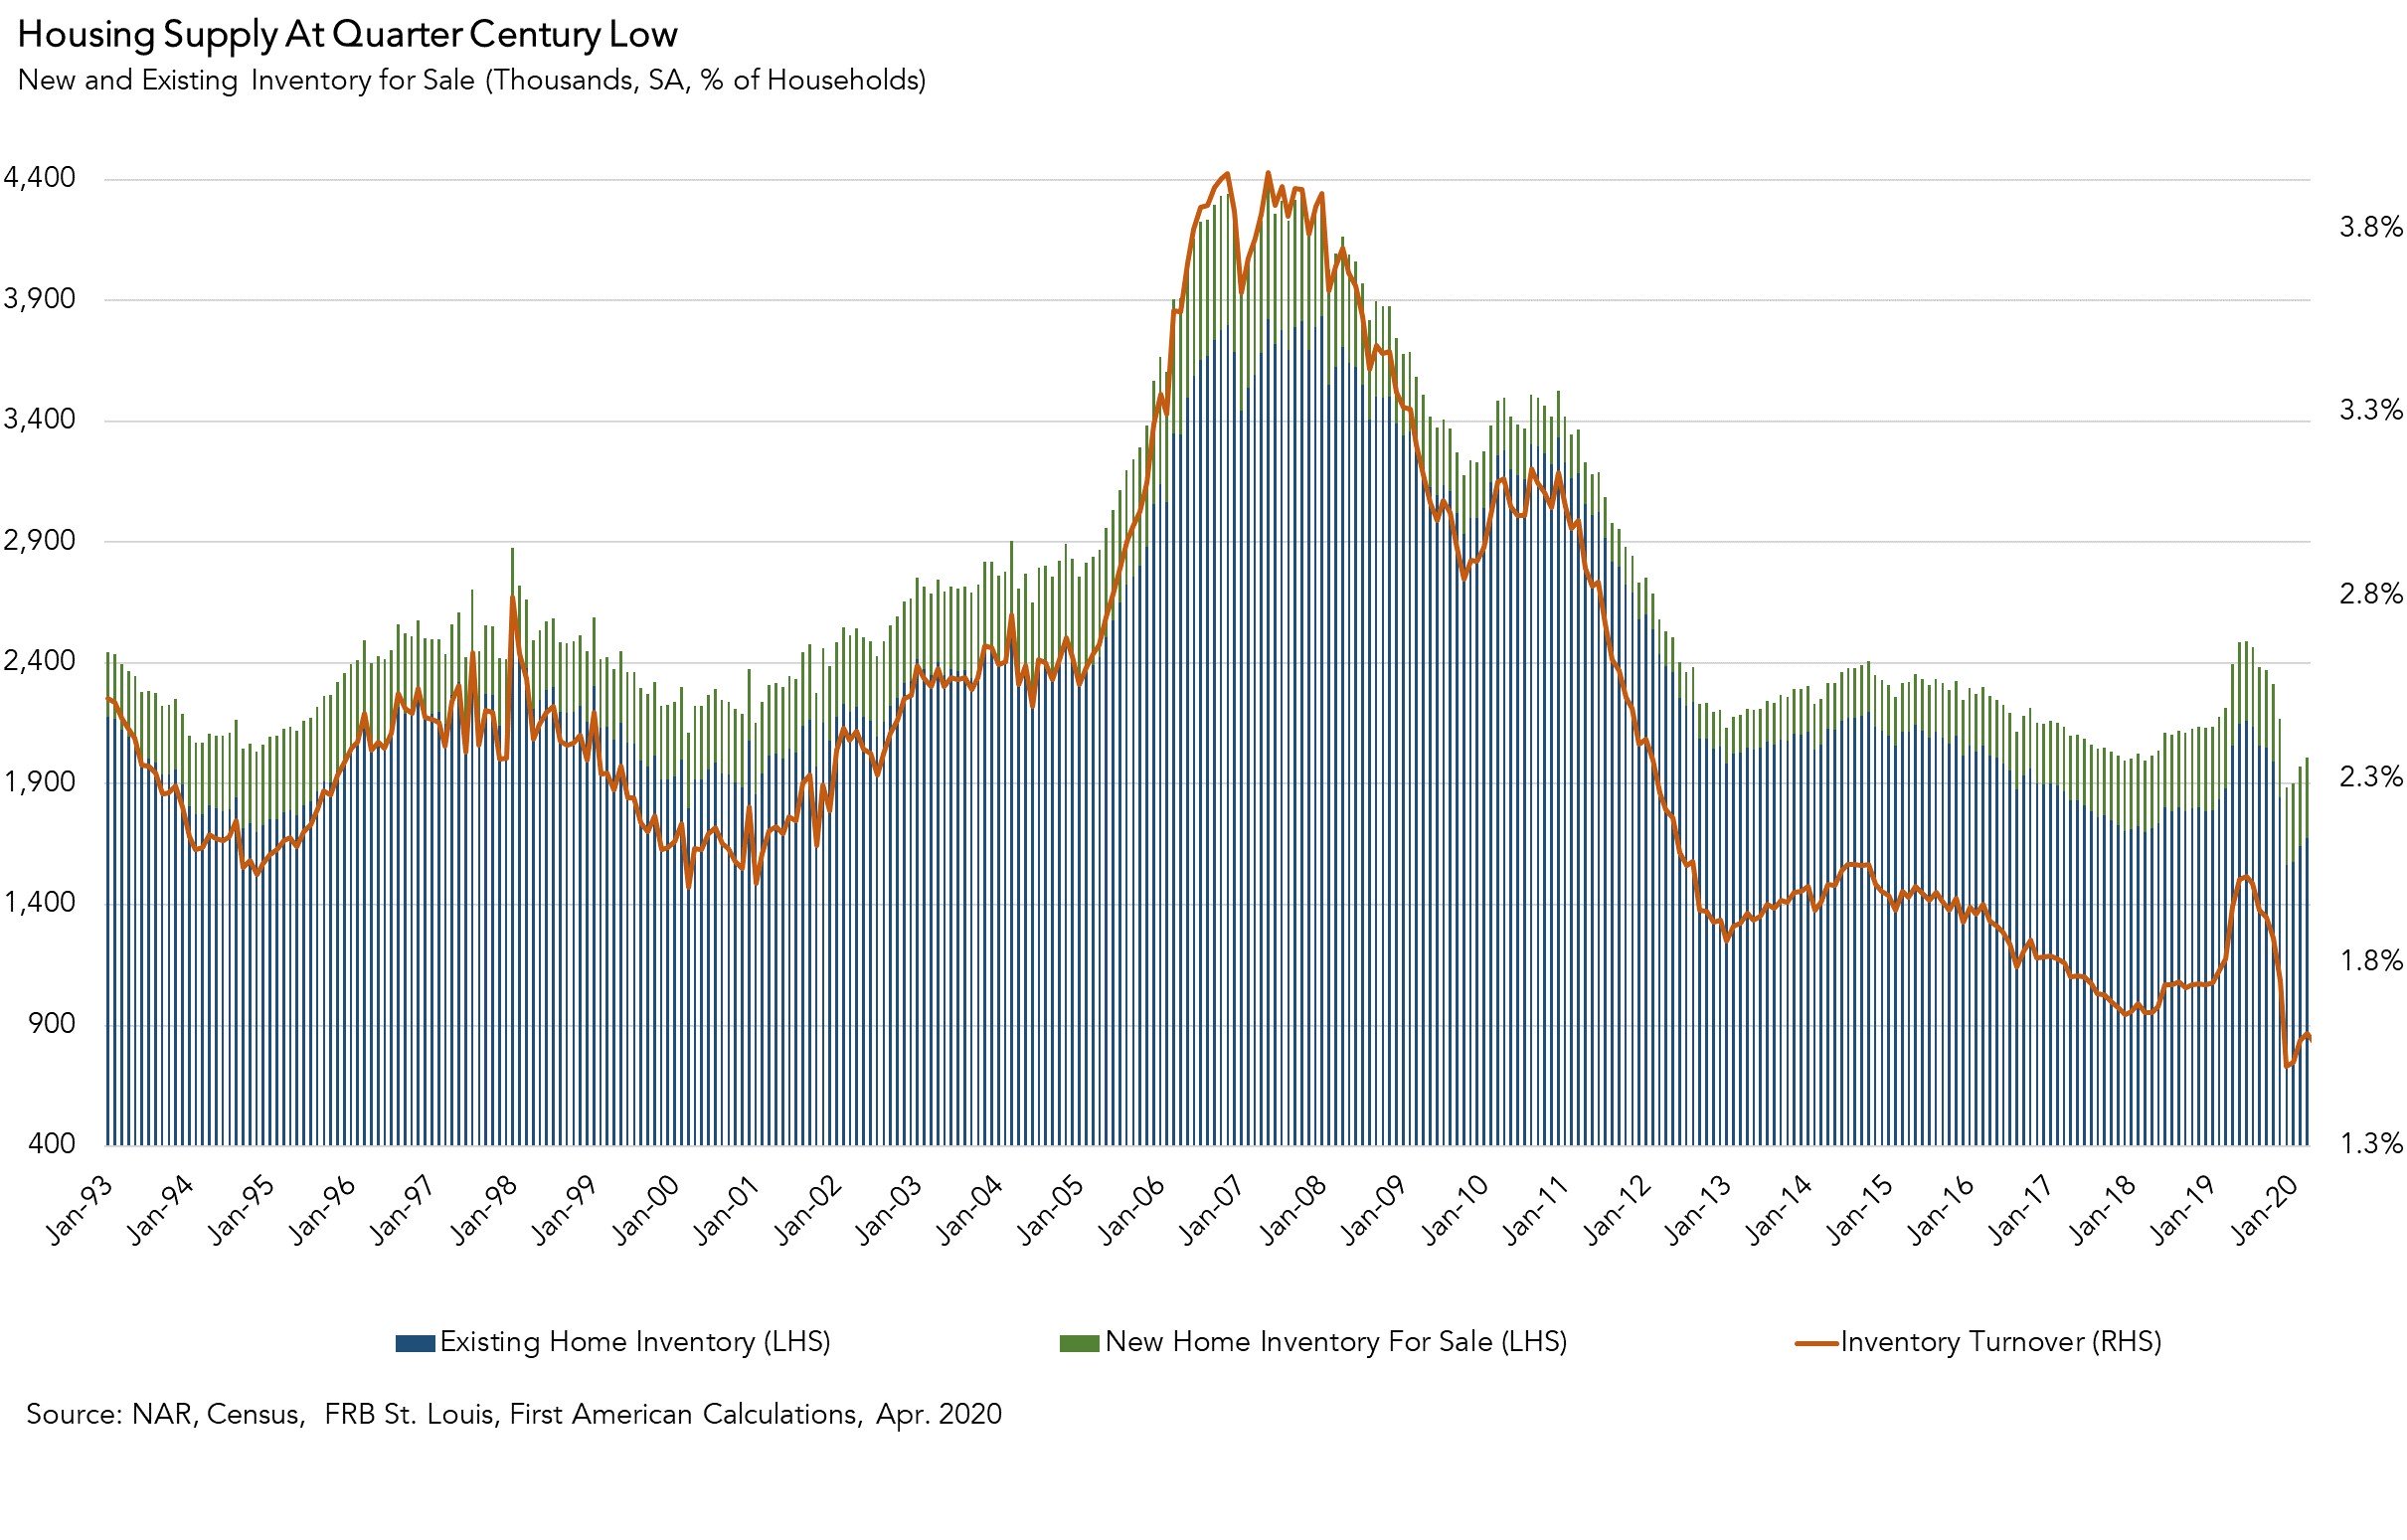
The graph below shows inventory turnover, the total supply of homes for sale nationwide as a percentage of occupied residential inventory. A quick look will show that inventory hit a 25-year low point in December 2019, with a turnover rate of 1.52 percent. In other words, only 152 homes in every 10,000 were for sale, well below the historical average of about 2.5 percent, or 250 homes in every 10,000. Since then, housing supply had slowly and modestly improved. Enter the pandemic in April. Housing inventory fell once more to 1.58 percent. The chart also breaks down inventory by its components: existing-home and new home inventory for sale. Existing-home sales make up approximately 90 percent of all home sales, which means more existing homeowners must sell their homes in order for supply to increase significantly.
But existing homeowners are staying put. Historically high tenure length of over 12 years means both fewer buyers and fewer homes on the market, and a reduction in existing-home sales. In the months preceding the pandemic, there was some modest improvement in the situation as the pace of tenure length growth had slowed, falling to 7.6 percent year-over-year in February. Then came the pandemic and the annual growth rate of tenure length accelerated to 8.5 percent in March and remained that high in April. As more homeowners were reluctant to list their homes for sale amid the pandemic, the supply of homes available to potential home buyers dwindled further. You can’t buy what’s not for sale.
Existing homeowners are staying home everywhere. Average tenure length increased in April in each of the 50 large metropolitan areas we track relative to one year ago. While beginning to slow in most markets in February, annual tenure length appreciation picked up the pace in 45 of the 50 markets once the economic impacts of the pandemic hit in March and April 2020. As pent-up demand from the pandemic-delayed spring home-buying season enters the market, potential home buyers have very limited inventory to choose from. Lack of supply relative to demand is a sure-fire recipe for increasing house price appreciation.
Link to Article~~~~~~~~~~~~~~~~~~~~~~~~~~~~~~~~~~~~~~~~~~~~~~
Our inventory has been very consistent in the past – there is only a 10% spread between the high and the low number of listings between 2014-2019. But now we have 20% fewer NSDCC listings than last year, and the median list price is 9% higher:
Number of NSDCC Listings Between January and May
| Year | ||
| 2014 | ||
| 2015 | ||
| 2016 | ||
| 2017 | ||
| 2018 | ||
| 2019 | ||
| 2020 |
There are additional variables in our market today that we’ve never experienced before, so maybe price will get less scrutiny? Will buyers just pay what it takes to get a house they like?


I wonder if Odeta likes X. She’s on the guest list for the next shindig!