What a great turnaround – last week we had 17 new pendings, and this week we had 29! The inventory of active listings has been steady too, with Monday counts of 660, 671, and 669 today.
My CV listing on Winstanley was shown six times over the weekend, and we sold it yesterday!
“In the middle of difficulty lies opportunity” Albert Einstein
The UNDER-$1,000,000 Market:
| Date |
NSDCC Active Listings |
Avg. LP/sf |
Avg. DOM |
# of Pendings |
| Jan 7 |
72 |
$469/sf |
55 |
49 |
| Jan 14 |
78 |
$487/sf |
49 |
48 |
| Jan 21 |
82 |
$488/sf |
49 |
49 |
| Jan 28 |
68 |
$480/sf |
53 |
64 |
| Feb 4 |
72 |
$483/sf |
53 |
69 |
| Feb 11 |
75 |
$481/sf |
45 |
74 |
| Feb 18 |
67 |
$482/sf |
46 |
76 |
| Feb 25 |
67 |
$494/sf |
47 |
67 |
| Mar 4 |
82 |
$478/sf |
38 |
64 |
| Mar 11 |
90 |
$471/sf |
36 |
65 |
| Mar 18 |
95 |
$475/sf |
37 |
69 |
| Mar 25 |
98 |
$463/sf |
36 |
72 |
| Apr 1 |
94 |
$462/sf |
38 |
71 |
| Apr 8 |
91 |
$455/sf |
42 |
75 |
| Apr 15 |
93 |
$463/sf |
42 |
75 |
| Apr 22 |
94 |
$481/sf |
44 |
78 |
| Apr 29 |
99 |
$469/sf |
43 |
84 |
| May 6 |
106 |
$466/sf |
38 |
81 |
| May 13 |
102 |
$470/sf |
38 |
78 |
| May 20 |
112 |
$453/sf |
31 |
79 |
| May 27 |
110 |
$464/sf |
34 |
80 |
| Jun 3 |
113 |
$469/sf |
33 |
84 |
| Jun 10 |
109 |
$463/sf |
36 |
88 |
| Jun 17 |
109 |
$465/sf |
35 |
89 |
| Jun 24 |
105 |
$474/sf |
37 |
84 |
| Jul 1 |
96 |
$474/sf |
38 |
79 |
| Jul 8 |
89 |
$472/sf |
46 |
85 |
| Jul 15 |
100 |
$490/sf |
43 |
82 |
| Jul 22 |
94 |
$494/sf |
44 |
84 |
| Jul 29 |
97 |
$493/sf |
44 |
78 |
| Aug 5 |
99 |
$490/sf |
43 |
69 |
| Aug 12 |
101 |
$482/sf |
39 |
65 |
| Aug 19 |
103 |
$487/sf |
39 |
64 |
| Aug 26 |
106 |
$476/sf |
44 |
59 |
| Sep 2 |
96 |
$471/sf |
48 |
59 |
| Sep 9 |
88 |
$477/sf |
48 |
59 |
| Sep 16 |
94 |
$474/sf |
41 |
56 |
| Sep 23 |
86 |
$467/sf |
46 |
56 |
| Sep 30 |
84 |
$467/sf |
50 |
58 |
| Oct 7 |
80 |
$487/sf |
44 |
56 |
| Oct 14 |
82 |
$478/sf |
44 |
54 |
| Oct 21 |
70 |
$470/sf |
47 |
57 |
| Oct 28 |
66 |
$458/sf |
44 |
52 |
| Nov 4 |
60 |
$460/sf |
40 |
50 |
| Nov 11 |
71 |
$462/sf |
44 |
56 |
| Nov 18 |
72 |
$472/sf |
36 |
59 |
| Nov 25 |
66 |
$473/sf |
39 |
61 |
| Dec 2 |
57 |
$481/sf |
43 |
58 |
| Dec 9 |
58 |
$458/sf |
38 |
48 |
| Dec 16 |
51 |
$458/sf |
43 |
51 |
| Dec 23 |
46 |
$463/sf |
46 |
49 |
| Dec 30 |
45 |
$460/sf |
48 |
43 |
| Jan 6 |
40 |
$453/sf |
51 |
40 |
| Jan 13 |
41 |
$483/sf |
48 |
42 |
| Jan 20 |
37 |
$467/sf |
51 |
51 |
| Jan 27 |
36 |
$462/sf |
46 |
51 |
| Feb 3 |
30 |
$464/sf |
51 |
52 |
| Feb 10 |
29 |
$459/sf |
39 |
59 |
| Feb 17 |
31 |
$451/sf |
37 |
60 |
| Feb 24 |
35 |
$470/sf |
32 |
57 |
| Mar 2 |
23 |
$454/sf |
42 |
54 |
| Mar 9 |
23 |
$473/sf |
32 |
62 |
| Mar 16 |
30 |
$476/sf |
31 |
59 |
| Mar 23 |
32 |
$486/sf |
33 |
55 |
| Mar 30 |
40 |
$475/sf |
32 |
44 |
| Apr 6 |
40 |
$476/sf |
32 |
34 |
| Apr 13 |
45 |
$486/sf |
31 |
32 |
| Apr 20 |
51 |
$500/sf |
30 |
34 |
The $1,000,000 – $1,500,000 Market:
| Date |
NSDCC Active Listings |
Avg. LP/sf |
Avg. DOM |
# of Pendings |
| Jan 7 |
154 |
$497/sf |
58 |
69 |
| Jan 14 |
158 |
$489/sf |
54 |
65 |
| Jan 21 |
161 |
$503/sf |
55 |
56 |
| Jan 28 |
169 |
$489/sf |
52 |
60 |
| Feb 4 |
167 |
$502/sf |
50 |
69 |
| Feb 11 |
157 |
$504/sf |
51 |
84 |
| Feb 18 |
168 |
$494/sf |
47 |
83 |
| Feb 25 |
175 |
$494/sf |
49 |
84 |
| Mar 4 |
174 |
$507/sf |
44 |
86 |
| Mar 11 |
175 |
$501/sf |
44 |
91 |
| Mar 18 |
194 |
$526/sf |
43 |
99 |
| Mar 25 |
189 |
$510/sf |
44 |
104 |
| Apr 1 |
188 |
$513/sf |
45 |
107 |
| Apr 8 |
215 |
$512/sf |
45 |
104 |
| Apr 15 |
211 |
$515/sf |
46 |
108 |
| Apr 22 |
201 |
$513/sf |
49 |
117 |
| Apr 29 |
193 |
$507/sf |
49 |
128 |
| May 6 |
211 |
$506/sf |
49 |
121 |
| May 13 |
201 |
$497/sf |
52 |
131 |
| May 20 |
207 |
$507/sf |
48 |
129 |
| May 27 |
198 |
$513/sf |
49 |
133 |
| Jun 3 |
197 |
$510/sf |
51 |
129 |
| Jun 10 |
204 |
$511/sf |
50 |
129 |
| Jun 17 |
198 |
$506/sf |
55 |
117 |
| Jun 24 |
192 |
$510/sf |
55 |
120 |
| Jul 1 |
198 |
$503/sf |
56 |
119 |
| Jul 8 |
186 |
$512/sf |
58 |
123 |
| Jul 15 |
191 |
$504/sf |
57 |
126 |
| Jul 22 |
189 |
$498/sf |
57 |
125 |
| Jul 29 |
192 |
$494/sf |
56 |
120 |
| Aug 5 |
186 |
$498/sf |
52 |
119 |
| Aug 12 |
180 |
$486/sf |
52 |
114 |
| Aug 19 |
179 |
$493/sf |
50 |
127 |
| Aug 26 |
183 |
$518/sf |
45 |
120 |
| Sep 2 |
184 |
$517/sf |
46 |
105 |
| Sep 9 |
182 |
$508/sf |
48 |
105 |
| Sep 16 |
188 |
$515/sf |
47 |
100 |
| Sep 23 |
185 |
$530/sf |
46 |
93 |
| Sep 30 |
179 |
$532/sf |
49 |
95 |
| Oct 7 |
179 |
$533/sf |
50 |
97 |
| Oct 14 |
171 |
$546/sf |
55 |
94 |
| Oct 21 |
165 |
$551/sf |
55 |
99 |
| Oct 28 |
160 |
$545/sf |
54 |
103 |
| Nov 4 |
151 |
$541/sf |
53 |
103 |
| Nov 11 |
147 |
$545/sf |
57 |
104 |
| Nov 18 |
142 |
$563/sf |
58 |
103 |
| Nov 25 |
133 |
$583/sf |
60 |
109 |
| Dec 2 |
125 |
$559/sf |
64 |
108 |
| Dec 9 |
122 |
$567/sf |
63 |
95 |
| Dec 16 |
111 |
$566/sf |
62 |
90 |
| Dec 23 |
98 |
$594/sf |
66 |
81 |
| Dec 30 |
94 |
$597/sf |
70 |
70 |
| Jan 6 |
89 |
$615/sf |
67 |
72 |
| Jan 13 |
93 |
$598/sf |
65 |
71 |
| Jan 20 |
87 |
$612/sf |
66 |
73 |
| Jan 27 |
93 |
$589/sf |
59 |
65 |
| Feb 3 |
96 |
$576/sf |
54 |
65 |
| Feb 10 |
94 |
$559/sf |
62 |
84 |
| Feb 17 |
80 |
$542/sf |
64 |
100 |
| Feb 24 |
90 |
$530/sf |
61 |
97 |
| Mar 2 |
93 |
$529/sf |
56 |
91 |
| Mar 9 |
100 |
$537/sf |
46 |
98 |
| Mar 16 |
101 |
$521/sf |
44 |
105 |
| Mar 23 |
111 |
$522/sf |
44 |
90 |
| Mar 30 |
114 |
$528/sf |
43 |
75 |
| Apr 6 |
115 |
$528/sf |
50 |
69 |
| Apr 13 |
116 |
$525/sf |
48 |
58 |
| Apr 20 |
118 |
$539/sf |
52 |
57 |
The $1,500,000 – $2,000,000 Market:
| Date |
NSDCC Active Listings |
Avg. LP/sf |
Avg. DOM |
# of Pendings |
| Jan 7 |
108 |
$628/sf |
86 |
33 |
| Jan 14 |
107 |
$647/sf |
83 |
37 |
| Jan 21 |
113 |
$665/sf |
77 |
39 |
| Jan 28 |
116 |
$676/sf |
76 |
42 |
| Feb 4 |
125 |
$665/sf |
73 |
41 |
| Feb 11 |
131 |
$670/sf |
72 |
43 |
| Feb 18 |
132 |
$674/sf |
71 |
49 |
| Feb 25 |
130 |
$670/sf |
66 |
53 |
| Mar 4 |
134 |
$677/sf |
59 |
59 |
| Mar 11 |
143 |
$674/sf |
57 |
53 |
| Mar 18 |
143 |
$649/sf |
56 |
67 |
| Mar 25 |
133 |
$642/sf |
56 |
66 |
| Apr 1 |
131 |
$621/sf |
53 |
69 |
| Apr 8 |
139 |
$618/sf |
49 |
77 |
| Apr 15 |
149 |
$630/sf |
50 |
75 |
| Apr 22 |
145 |
$616/sf |
50 |
72 |
| Apr 29 |
148 |
$605/sf |
49 |
77 |
| May 6 |
157 |
$606/sf |
48 |
74 |
| May 13 |
159 |
$599/sf |
47 |
72 |
| May 20 |
170 |
$612/sf |
48 |
73 |
| May 27 |
165 |
$595/sf |
50 |
79 |
| Jun 3 |
172 |
$607/sf |
52 |
70 |
| Jun 10 |
181 |
$604/sf |
52 |
70 |
| Jun 17 |
186 |
$610/sf |
56 |
69 |
| Jun 24 |
197 |
$616/sf |
56 |
59 |
| Jul 1 |
195 |
$600/sf |
58 |
65 |
| Jul 8 |
191 |
$610/sf |
58 |
71 |
| Jul 15 |
194 |
$601/sf |
58 |
69 |
| Jul 22 |
189 |
$608/sf |
58 |
74 |
| Jul 29 |
194 |
$606/sf |
60 |
73 |
| Aug 5 |
203 |
$614/sf |
61 |
67 |
| Aug 12 |
207 |
$612/sf |
64 |
65 |
| Aug 19 |
199 |
$596/sf |
64 |
79 |
| Aug 26 |
200 |
$598/sf |
64 |
79 |
| Sep 2 |
203 |
$614/sf |
62 |
69 |
| Sep 9 |
195 |
$600/sf |
66 |
73 |
| Sep 16 |
198 |
$596/sf |
66 |
65 |
| Sep 23 |
197 |
$590/sf |
68 |
75 |
| Sep 30 |
191 |
$596/sf |
68 |
74 |
| Oct 7 |
184 |
$608/sf |
70 |
77 |
| Oct 14 |
177 |
$608/sf |
61 |
79 |
| Oct 21 |
177 |
$600/sf |
62 |
71 |
| Oct 28 |
177 |
$580/sf |
61 |
67 |
| Nov 4 |
170 |
$595/sf |
62 |
67 |
| Nov 11 |
162 |
$590/sf |
66 |
71 |
| Nov 18 |
150 |
$602/sf |
69 |
70 |
| Nov 25 |
141 |
$605/sf |
69 |
74 |
| Dec 2 |
130 |
$600/sf |
69 |
73 |
| Dec 9 |
134 |
$618/sf |
65 |
63 |
| Dec 16 |
126 |
$620/sf |
70 |
59 |
| Dec 23 |
125 |
$612/sf |
77 |
53 |
| Dec 30 |
113 |
$627/sf |
79 |
62 |
| Jan 6 |
113 |
$605/sf |
71 |
57 |
| Jan 13, 2020 |
113 |
$664/sf |
67 |
59 |
| Jan 20 |
113 |
$658/sf |
61 |
50 |
| Jan 27 |
103 |
$654/sf |
66 |
59 |
| Feb 3 |
104 |
$664/sf |
60 |
59 |
| Feb 10 |
110 |
$667/sf |
54 |
62 |
| Feb 17 |
111 |
$650/sf |
55 |
72 |
| Feb 24 |
110 |
$634/sf |
60 |
76 |
| Mar 2 |
115 |
$644/sf |
51 |
77 |
| Mar 9 |
121 |
$665/sf |
50 |
80 |
| Mar 16 |
125 |
$665/sf |
49 |
79 |
| Mar 23 |
119 |
$665/sf |
52 |
70 |
| Mar 30 |
126 |
$660/sf |
51 |
59 |
| Apr 6 |
130 |
$650/sf |
51 |
56 |
| Apr 13 |
132 |
$646/sf |
56 |
49 |
| Apr 20 |
138 |
$658/sf |
53 |
47 |
The $2,000,000 – $3,000,000 Market:
| Date |
NSDCC Active Listings |
Avg. LP/sf |
Avg. DOM |
# of Pendings |
| Dec 30, 2019 |
161 |
$744/sf |
106 |
33 |
| Jan 6, 2020 |
147 |
$756/sf |
97 |
31 |
| Jan 13, 2020 |
149 |
$755/sf |
94 |
27 |
| Jan 20, 2020 |
150 |
$749/sf |
89 |
27 |
| Jan 27, 2020 |
154 |
$738/sf |
91 |
29 |
| Feb 3, 2020 |
162 |
$745/sf |
86 |
33 |
| Feb 10, 2020 |
169 |
$753/sf |
83 |
33 |
| Feb 17, 2020 |
166 |
$735/sf |
81 |
43 |
| Feb 24, 2020 |
155 |
$737/sf |
86 |
58 |
| Mar 2, 2020 |
156 |
$731/sf |
78 |
55 |
| Mar 9, 2020 |
157 |
$726/sf |
78 |
61 |
| Mar 16, 2020 |
166 |
$736/sf |
75 |
57 |
| Mar 23, 2020 |
167 |
$730/sf |
79 |
45 |
| Mar 30, 2020 |
163 |
$734/sf |
80 |
44 |
| Apr 6, 2020 |
153 |
$771/sf |
81 |
37 |
| Apr 13, 2020 |
159 |
$765/sf |
78 |
33 |
| Apr 20, 2020 |
153 |
$773/sf |
80 |
37 |
The $3,000,000+ Market:
| Date |
NSDCC Active Listings |
Avg. LP/sf |
Avg. DOM |
# of Pendings |
| Dec 30, 2019 |
267 |
$1,226/sf |
144 |
28 |
| Jan 6, 2020 |
246 |
$1,218/sf |
138 |
29 |
| Jan 13, 2020 |
256 |
$1,173/sf |
133 |
28 |
| Jan 20, 2020 |
261 |
$1,158/sf |
128 |
27 |
| Jan 27, 2020 |
258 |
$1,163/sf |
128 |
27 |
| Feb 3, 2020 |
258 |
$1,162/sf |
127 |
32 |
| Feb 10, 2020 |
259 |
$1,172/sf |
124 |
37 |
| Feb 17, 2020 |
265 |
$1,140/sf |
118 |
36 |
| Feb 24, 2020 |
268 |
$1,150/sf |
120 |
39 |
| Mar 2, 2020 |
267 |
$1,119/sf |
121 |
37 |
| Mar 9, 2020 |
276 |
$1,118/sf |
119 |
38 |
| Mar 16, 2020 |
276 |
$1,116/sf |
118 |
40 |
| Mar 23, 2020 |
256 |
$1,142/sf |
128 |
40 |
| Mar 30, 2020 |
244 |
$1,150/sf |
131 |
40 |
| Apr 6, 2020 |
231 |
$1,168/sf |
129 |
28 |
| Apr 13, 2020 |
230 |
$1,183/sf |
132 |
25 |
| Apr 20, 2020 |
224 |
$1,165/sf |
137 |
22 |
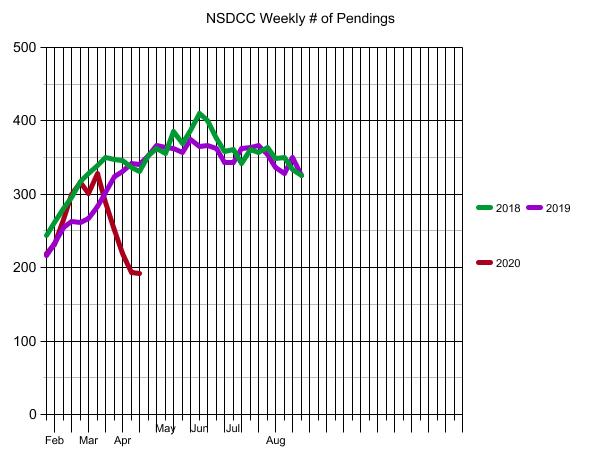
Weekly NSDCC New Listings and New Pendings
| Week |
New Listings |
New Pendings |
Total Pendings |
| Jan 1, 2018 |
18 |
15 |
| Jan 8 |
89 |
31 |
| Jan 15 |
87 |
43 |
| Jan 22 |
87 |
43 |
| Jan 29 |
81 |
48 |
244 |
| Feb 5 |
77 |
53 |
262 |
| Feb 12 |
74 |
53 |
280 |
| Feb 19 |
89 |
55 |
295 |
| Feb 26 |
87 |
57 |
318 |
| Mar 5 |
84 |
62 |
328 |
| Mar 12 |
107 |
61 |
339 |
| Mar 19 |
88 |
59 |
350 |
| Mar 26 |
99 |
55 |
347 |
| Apr 2 |
87 |
66 |
346 |
| Apr 9 |
106 |
58 |
336 |
| Apr 16 |
98 |
54 |
331 |
| Apr 23 |
108 |
67 |
353 |
| Apr 30 |
98 |
70 |
362 |
| May 7 |
138 |
68 |
355 |
| May 14 |
99 |
78 |
386 |
| May 21 |
115 |
63 |
369 |
| May 28 |
92 |
84 |
387 |
| Jun 4 |
91 |
77 |
410 |
| Jun 11 |
100 |
56 |
401 |
| Jun 18 |
103 |
54 |
376 |
| Jun 25 |
105 |
54 |
358 |
| Jul 2 |
83 |
78 |
361 |
| Jul 9 |
74 |
50 |
342 |
| Jul 16 |
109 |
83 |
361 |
| Jul 23 |
101 |
54 |
357 |
| Jul 30 |
97 |
67 |
364 |
| Aug 6 |
101 |
60 |
349 |
| Aug 13 |
103 |
54 |
350 |
| Aug 20 |
89 |
58 |
334 |
| Aug 27 |
83 |
46 |
325 |
| Sep 3 |
80 |
59 |
312 |
| Sep 10 |
83 |
46 |
302 |
| Sep 17 |
91 |
53 |
305 |
| Sep 24 |
85 |
41 |
296 |
| Oct 1 |
95 |
47 |
302 |
| Oct 8 |
93 |
55 |
307 |
| Oct 15 |
84 |
40 |
291 |
| Oct 22 |
101 |
51 |
298 |
| Oct 29 |
69 |
55 |
299 |
| Nov 5 |
75 |
49 |
293 |
| Nov 12 |
82 |
43 |
284 |
| Nov 19 |
59 |
42 |
282 |
| Nov 26 |
33 |
27 |
270 |
| Dec 3 |
67 |
45 |
264 |
| Dec 10 |
66 |
37 |
247 |
| Dec 17 |
34 |
37 |
231 |
| Dec 24 |
29 |
37 |
212 |
| Dec 31 |
12 |
20 |
211 |
| Jan 7, 2019 |
92 |
24 |
203 |
| Jan 14 |
81 |
35 |
205 |
| Jan 21 |
77 |
33 |
196 |
| Jan 28 |
87 |
47 |
217 |
| Feb 4 |
92 |
45 |
233 |
| Feb 11 |
83 |
48 |
255 |
| Feb 18 |
84 |
52 |
263 |
| Feb 25 |
72 |
39 |
261 |
| Mar 4 |
113 |
52 |
267 |
| Mar 11 |
122 |
63 |
284 |
| Mar 18 |
100 |
64 |
302 |
| Mar 25 |
95 |
70 |
324 |
| Apr 1 |
87 |
53 |
331 |
| Apr 8 |
113 |
58 |
342 |
| Apr 15 |
104 |
59 |
341 |
| Apr 22 |
94 |
67 |
353 |
| Apr 29 |
117 |
74 |
367 |
| May 6 |
113 |
67 |
364 |
| May 13 |
86 |
48 |
362 |
| May 20 |
132 |
55 |
357 |
| May 27 |
100 |
78 |
375 |
| Jun 3 |
109 |
55 |
365 |
| Jun 10 |
106 |
54 |
366 |
| Jun 17 |
94 |
59 |
363 |
| Jun 24 |
97 |
63 |
344 |
| Jul 1 |
89 |
53 |
343 |
| Jul 8 |
81 |
66 |
363 |
| Jul 15 |
115 |
59 |
364 |
| Jul 22 |
89 |
72 |
367 |
| Jul 29 |
102 |
47 |
354 |
| Aug 5 |
102 |
47 |
336 |
| Aug 12 |
96 |
51 |
328 |
| Aug 19 |
89 |
61 |
350 |
| Aug 26 |
86 |
40 |
326 |
| Sep 2 |
67 |
44 |
300 |
| Sep 9 |
75 |
52 |
305 |
| Sep 16 |
102 |
46 |
296 |
| Sep 23 |
67 |
59 |
301 |
| Sep 30 |
68 |
56 |
306 |
| Oct 7 |
76 |
44 |
305 |
| Oct 14 |
78 |
51 |
302 |
| Oct 21 |
71 |
49 |
296 |
| Oct 28 |
76 |
55 |
291 |
| Nov 4 |
87 |
54 |
283 |
| Nov 11 |
61 |
52 |
291 |
| Nov 18 |
69 |
50 |
288 |
| Nov 25 |
60 |
57 |
303 |
| Dec 2 |
19 |
34 |
297 |
| Dec 9 |
58 |
29 |
261 |
| Dec 16 |
45 |
40 |
251 |
| Dec 23 |
32 |
37 |
232 |
| Dec 30 |
16 |
26 |
226 |
| Jan 6 |
56 |
21 |
218 |
| Jan 13 |
76 |
33 |
214 |
| Jan 20 |
71 |
53 |
217 |
| Jan 27 |
62 |
38 |
220 |
| Feb 3 |
75 |
46 |
232 |
| Feb 10 |
97 |
72 |
265 |
| Feb 17 |
82 |
58 |
300 |
| Feb 24 |
70 |
53 |
316 |
| Mar 2 |
79 |
55 |
301 |
| Mar 9 |
106 |
66 |
328 |
| Mar 16 |
83 |
55 |
329 |
| Mar 23 |
59 |
31 |
289 |
| Mar 30 |
63 |
31 |
251 |
| Apr 6 |
57 |
21 |
219 |
| Apr 13 |
48 |
17 |
194 |
| Apr 20 |
63 |
29 |
192 |


More rampant guessing, but at least Zandi is coming around:
“With affordable housing in extraordinarily short supply, the house price declines will be limited, and given the tight mortgage underwriting and plain vanilla fixed-rate mortgage loans originated since the crisis, so too will the foreclosures,” wrote Mark Zandi, chief economist at Moody’s Analytics.
There has also been a slowdown in asking prices. In early March, median list prices were up 4.4% annually on average. In the first half of April they were up just under 1%. That’s the slowest growth in seven years.
“Although prices are still rising compared to last year, slower gains are indicative of early market response to economic uncertainty and hurdles to completing a transaction, along with lower buyer and seller sentiment,” said Danielle Hale, chief economist at realtor.com. “While asking prices do not normally react so quickly to market conditions, Fannie Mae’s recent housing market sentiment survey showed a bigger potential seller response to COVID-19 than the potential buyer response, which could help explain why asking prices are reacting rapidly.”
All real estate is local, and prices will be under the most pressure in areas where the economies depend on leisure and hospitality, according to a new report from UBS. The report mentions Las Vegas, Miami and Orlando, Florida, which were some of the hardest-hit markets during the subprime crisis.
In addition, UBS lists Houston as high risk, because of its exposure to energy companies. Oil prices have plummeted amid infighting among OPEC nations and a sharp drop in gasoline usage as millions of people around the world shelter at home.
Markets where affordability was already stretched, like San Francisco, Los Angeles, San Diego and Seattle, are also at higher risk of price declines. In New York City, home prices had already been tanking, due to oversupply and changes to real estate tax laws that had benefited homeownership. Now the city is the epicenter of the nation’s coronavirus crisis, and values have nowhere to go but down.
While home sales are down dramatically, there are some transactions happening. People who have to buy or sell are still doing so, and some are out hunting for bargains, albeit hunting virtually. Realtor.com just added live open houses to its offerings, so people can talk to an agent in real time as the agent walks through the house. Other brokerages are doing the same.
There will of course be pent-up demand at the end of all of this, but consumer confidence in the economy will play an even bigger role than usual. That is why some disagree with the strength of home prices and see a potential for wide-scale price drops, at least temporarily.
“Uncertainty destroys value,” said Ken Johnson an economist at Florida Atlantic University. “The more uncertainty there is, the more a potential buyer will discount the value of the home.”
https://www.cnbc.com/2020/04/20/these-markets-could-see-the-sharpest-drop-in-home-prices-during-coronavirus-pandemic.html
This time isn’t Great Bubble 2.0 but in one aspect prior to Coronaville it was sellers asking for the next years’ of appreciation in the advertised price. Perhaps a shift to present price or perhaps sharing some part of future declines? THat’s just crazy talk. they ain’t gonna give it away.