

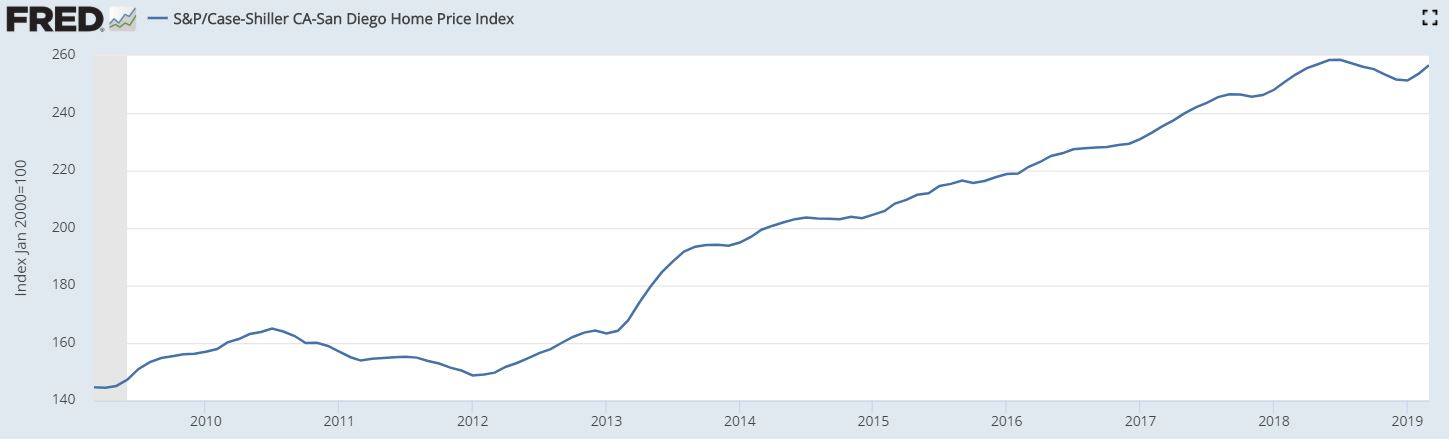
I calculated the monthly increase incorrectly last month – it’s right now, and it shows that the index has picked up steam lately. But we’re still slightly below last year’s peak of 258 in June & July:
San Diego Non-Seasonally-Adjusted CSI changes:
| Observation Month | |||
| January ’18 | |||
| February | |||
| March | |||
| April | |||
| May | |||
| Jun | |||
| Jul | |||
| Aug | |||
| Sept | |||
| Oct | |||
| Nov | |||
| Dec | |||
| January ’19 | |||
| Feb | |||
| Mar |
The index is 3.4% higher than it was at the beginning of 2018, but it could be worse.
This NYC broker says homeowners in Manhattan can figure what their home was worth in May, 2018, and then subtract 10% to find today’s value – yikes!


I wonder if that 10% drop in NYC prices will eventually flow westward? Or is it simply that prices in NYC just went way too high and we still have room to grow on the west coast?
We will get a report from Kayla – she will be back to SD next week!
From the UT:
Home prices in the San Diego metropolitan area rose 1.3 percent in a year, down from 7.7 percent at the same time in 2018, said the S&P CoreLogic Case-Shiller Indices released Tuesday.
San Diego metro prices gains were the lowest in the nation for fourth month in a row on the 20-city index. It was tied with Los Angeles metro, also at 1.3 percent, joining other expensive markets in substantial drops.
Analysts point to modest wage gains and prices going up too quickly as reasons why buyers are staying out of the market. Nationwide price gains were still nearly double the rate of inflation at 3.7 percent, although that is down from 6.5 percent at the same time last year.
“Given the broader economic picture, housing should be doing better,” wrote David Blitzer, managing director of the index. “Mortgage rates are at 4 percent for a 30-year fixed rate loan, unemployment is close to a 50-year low, (there is) low inflation and moderate increases in real incomes would be expected to support a strong housing market.”
The last time home price increases in San Diego metro were as slow was summer 2012. Yet prices are still going up, unlike the Great Recession when prices were down annually by double digits. In October 2008, home prices were down 26.67 percent year-over-year.
Lower cost markets across the United States saw the biggest gains in March. Prices were up 8.2 percent in the Las Vegas metropolitan area, 6.1 percent in Phoenix, 5.3 percent in Tampa and 4.7 percent in Atlanta.
In addition to Los Angeles and San Diego, other high cost markets were at the bottom of gains for the list. Seattle was up 1.6 percent, down from 13 percent last March, and San Francisco up 1.4 percent, down from 11.3 percent last March.
Analysts said slowed price gains did not mean it was a buyer’s market in high-priced metros because of historically low inventory and prices out of reach for many.
“Despite the slowdown, home values continue to appreciate and affordability constraints remain in place,” wrote Zillow economic analyst Matthew Speakman, “prohibiting many would-be buyers from entering the market and limiting the meaningful uptick in sales volumes that low mortgage rates might typically generate.”
The indices evaluate home prices by more than just price, tracking repeat sales of identical single-family houses as they turn over through the years. Prices are adjusted for seasonal swings. The median home price for a resale home in March was $600,000, said CoreLogic.
Mortgage interest rates in March were less than they were at the same time last year, said Mortgage News Daily. The interest rate was roughly 4.1 percent at the end of March for a 30-year, fixed rate mortgage, compared to around 4.5 percent at the same time in 2018.
While interest rates did not seem to kick start the market much in March, there is some belief it could make a difference in coming months. Ralph McLaughlin, deputy chief economist at CoreLogic, said he expected mortgage rates would continue to decline.
“This should help to take the cold edge off what has otherwise been a market slow to thaw from the winter months,” he said.
https://www.sandiegouniontribune.com/business/real-estate/story/2019-05-28/san-diego-home-price-gains-lowest-in-nation-for-4th-month