A few general observations as the 2019 market continues to liftoff.
- At the Inventory Watch, we are measuring the active listings, which are the unsold listings – so we are measuring what isn’t working, at least not yet. In the past, it was just a matter of time before the rising market came up enough to meet every seller and their price, but now we’re not as confident about when that might happen. It may take a lot longer before pricing rises substantially, and we could plateau for years to come.
- Rising inventory gives buyers more confidence that waiting longer will produce better results. It used to happen like that when banks were selling REOs for whatever the market would bear, but now that those days are over. Will there be sellers who want/need to sell for whatever the market will bear, or will they wait? (which would create a glut of unsold listings)
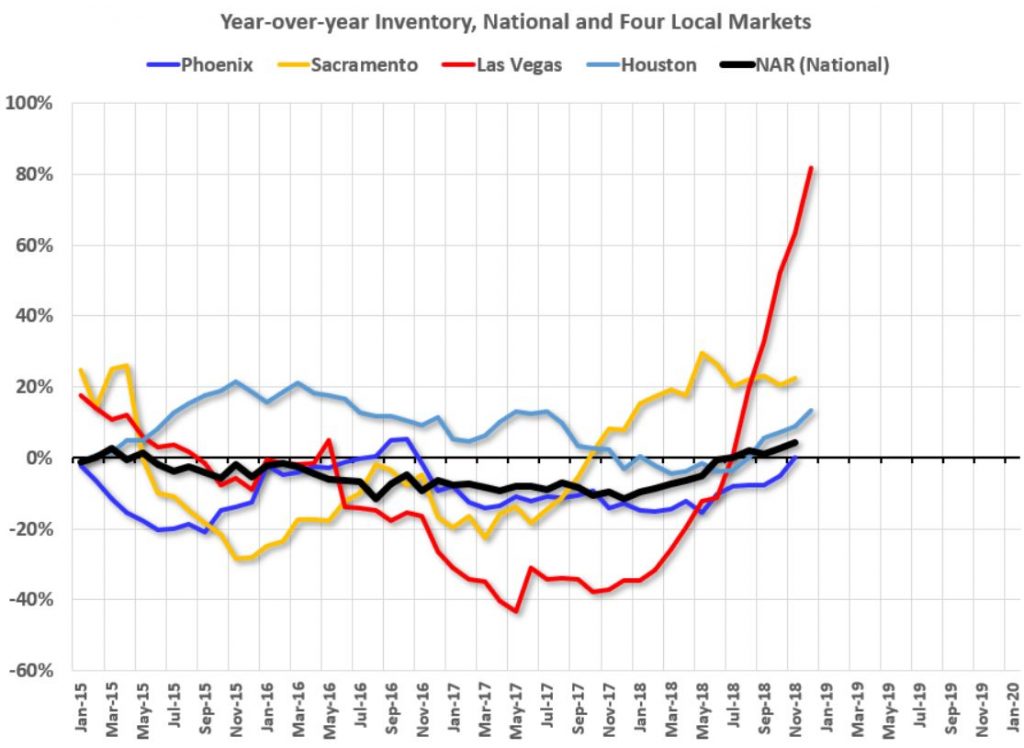
- Markets will vary. You can see in Bill’s graph above that inventory behaves differently, and it’s really an indicator of how much sellers and listing agents are holding out on price. Our current inventory is +24% year-over-year, which is mellow given our higher price point compared to those in the graph.
Are you coming off vacation and getting back in the swing? Click here to register your guess of how many total listings we will have between Jan 1 and Feb 28 – the closest will receive four tickets to a Padres game!
The UNDER-$1,000,000 Market:
| Date |
NSDCC Active Listings |
Avg. LP/sf |
Avg. DOM |
# of Pendings |
| Jan 1 |
36 |
$477/sf |
51 |
58 |
| Jan 8 |
35 |
$479/sf |
42 |
56 |
| Jan 15 |
39 |
$469/sf |
37 |
53 |
| Jan 22 |
37 |
$453/sf |
42 |
62 |
| Jan 29 |
38 |
$459/sf |
35 |
64 |
| Feb 5 |
41 |
$463/sf |
26 |
69 |
| Feb 12 |
39 |
$461/sf |
20 |
73 |
| Feb 19 |
42 |
$456/sf |
20 |
72 |
| Feb 26 |
53 |
$451/sf |
20 |
81 |
| Mar 5 |
47 |
$457/sf |
24 |
79 |
| Mar 12 |
60 |
$434/sf |
19 |
87 |
| Mar 19 |
67 |
$478/sf |
21 |
81 |
| Mar 26 |
61 |
$477/sf |
23 |
86 |
| Apr 2 |
50 |
$464/sf |
24 |
95 |
| Apr 9 |
56 |
$471/sf |
23 |
93 |
| Apr 16 |
61 |
$464/sf |
24 |
93 |
| Apr 23 |
59 |
$459/sf |
25 |
96 |
| Apr 30 |
61 |
$466/sf |
27 |
95 |
| May 7 |
67 |
$472/sf |
20 |
89 |
| May 14 |
66 |
$480/sf |
21 |
95 |
| May 21 |
81 |
$474/sf |
21 |
85 |
| May 28 |
83 |
$438/sf |
24 |
91 |
| Jun 4 |
80 |
$442/sf |
27 |
97 |
| Jun 11 |
81 |
$427/sf |
27 |
91 |
| Jun 18 |
88 |
$442/sf |
29 |
78 |
| Jun 25 |
93 |
$442/sf |
31 |
77 |
| Jul 2 |
96 |
$443/sf |
30 |
76 |
| Jul 9 |
98 |
$447/sf |
33 |
65 |
| Jul 16 |
98 |
$445/sf |
34 |
78 |
| Jul 23 |
97 |
$436/sf |
34 |
68 |
| Jul 30 |
116 |
$433/sf |
32 |
71 |
| Aug 6 |
111 |
$434/sf |
31 |
64 |
| Aug 13 |
115 |
$434/sf |
34 |
64 |
| Aug 20 |
110 |
$426/sf |
37 |
58 |
| Aug 27 |
117 |
$430/sf |
36 |
64 |
| Sep 3 |
109 |
$427/sf |
38 |
62 |
| Sep 10 |
113 |
$436/sf |
36 |
61 |
| Sep 17 |
117 |
$439/sf |
36 |
59 |
| Sep 24 |
109 |
$440/sf |
37 |
61 |
| Oct 1 |
100 |
$441/sf |
40 |
67 |
| Oct 8 |
106 |
$441/sf |
40 |
66 |
| Oct 15 |
112 |
$434/sf |
43 |
57 |
| Oct 22 |
111 |
$426/sf |
42 |
63 |
| Oct 29 |
114 |
$422/sf |
41 |
64 |
| Nov 5 |
110 |
$418/sf |
44 |
58 |
| Nov 12 |
115 |
$449/sf |
42 |
60 |
| Nov 19 |
111 |
$449/sf |
42 |
60 |
| Nov 26 |
106 |
$450/sf |
49 |
60 |
| Dec 3 |
99 |
$454/sf |
47 |
56 |
| Dec 10 |
99 |
$455/sf |
47 |
55 |
| Dec 17 |
89 |
$450/sf |
49 |
51 |
| Dec 24 |
83 |
$462/sf |
55 |
51 |
| Dec 31 |
78 |
$462/sf |
61 |
49 |
| Jan 7 |
72 |
$469/sf |
55 |
49 |
| Jan 14 |
78 |
$487/sf |
49 |
48 |
The $1,000,000 – $1,500,000 Market:
| Date |
NSDCC Active Listings |
Avg. LP/sf |
Avg. DOM |
# of Pendings |
| Jan 1 |
91 |
$532/sf |
72 |
68 |
| Jan 8 |
99 |
$551/sf |
64 |
64 |
| Jan 15 |
96 |
$535/sf |
61 |
75 |
| Jan 22 |
107 |
$515/sf |
63 |
82 |
| Jan 29 |
108 |
$512/sf |
57 |
91 |
| Feb 5 |
110 |
$518/sf |
49 |
100 |
| Feb 12 |
117 |
$487/sf |
46 |
106 |
| Feb 19 |
107 |
$500/sf |
45 |
114 |
| Feb 26 |
112 |
$485/sf |
46 |
117 |
| Mar 5 |
111 |
$496/sf |
45 |
115 |
| Mar 12 |
126 |
$475/sf |
43 |
109 |
| Mar 19 |
125 |
$487/sf |
47 |
129 |
| Mar 26 |
133 |
$484/sf |
47 |
124 |
| Apr 2 |
139 |
$495/sf |
47 |
121 |
| Apr 9 |
148 |
$485/sf |
51 |
119 |
| Apr 16 |
145 |
$474/sf |
45 |
114 |
| Apr 23 |
162 |
$470/sf |
43 |
117 |
| Apr 30 |
162 |
$486/sf |
42 |
121 |
| May 7 |
180 |
$495/sf |
40 |
117 |
| May 14 |
182 |
$491/sf |
41 |
127 |
| May 21 |
184 |
$475/sf |
40 |
135 |
| May 28 |
188 |
$473/sf |
40 |
139 |
| Jun 4 |
189 |
$469/sf |
43 |
148 |
| Jun 11 |
199 |
$469/sf |
45 |
142 |
| Jun 18 |
193 |
$465/sf |
44 |
143 |
| Jun 25 |
211 |
$476/sf |
39 |
141 |
| Jul 2 |
206 |
$483/sf |
41 |
142 |
| Jul 9 |
201 |
$483/sf |
45 |
146 |
| Jul 16 |
200 |
$502/sf |
44 |
145 |
| Jul 23 |
217 |
$504/sf |
45 |
148 |
| Jul 30 |
210 |
$493/sf |
48 |
154 |
| Aug 6 |
209 |
$493/sf |
45 |
146 |
| Aug 13 |
214 |
$496/sf |
44 |
147 |
| Aug 20 |
205 |
$494/sf |
46 |
145 |
| Aug 27 |
211 |
$493/sf |
46 |
134 |
| Sep 3 |
207 |
$486/sf |
45 |
129 |
| Sep 10 |
211 |
$489/sf |
47 |
125 |
| Sep 17 |
194 |
$483/sf |
49 |
120 |
| Sep 24 |
209 |
$476/sf |
49 |
108 |
| Oct 1 |
207 |
$476/sf |
48 |
107 |
| Oct 8 |
201 |
$481/sf |
48 |
110 |
| Oct 15 |
203 |
$487/sf |
48 |
110 |
| Oct 22 |
203 |
$492/sf |
48 |
108 |
| Oct 29 |
204 |
$495/sf |
51 |
104 |
| Nov 5 |
204 |
$490/sf |
53 |
98 |
| Nov 12 |
198 |
$498/sf |
52 |
97 |
| Nov 19 |
192 |
$498/sf |
55 |
93 |
| Nov 26 |
181 |
$492/sf |
58 |
92 |
| Dec 3 |
174 |
$478/sf |
57 |
93 |
| Dec 10 |
164 |
$487/sf |
60 |
88 |
| Dec 17 |
157 |
$487/sf |
62 |
85 |
| Dec 24 |
148 |
$493/sf |
65 |
75 |
| Dec 31 |
147 |
$495/sf |
64 |
76 |
| Jan 7 |
154 |
$497/sf |
58 |
69 |
| Jan 14 |
158 |
$489/sf |
54 |
65 |
The $1,500,000 – $2,000,000 Market:
| Date |
NSDCC Active Listings |
Avg. LP/sf |
Avg. DOM |
# of Pendings |
| Jan 1 |
84 |
$612/sf |
86 |
40 |
| Jan 8 |
98 |
$612/sf |
73 |
42 |
| Jan 15 |
98 |
$607/sf |
73 |
42 |
| Jan 22 |
111 |
$589/sf |
63 |
42 |
| Jan 29 |
120 |
$577/sf |
61 |
45 |
| Feb 5 |
114 |
$586/sf |
56 |
51 |
| Feb 12 |
118 |
$566/sf |
52 |
57 |
| Feb 19 |
121 |
$596/sf |
53 |
64 |
| Feb 26 |
122 |
$596/sf |
53 |
64 |
| Mar 5 |
125 |
$593/sf |
56 |
70 |
| Mar 12 |
131 |
$602/sf |
53 |
67 |
| Mar 19 |
120 |
$598/sf |
58 |
74 |
| Mar 26 |
121 |
$596/sf |
57 |
75 |
| Apr 2 |
128 |
$593/sf |
55 |
70 |
| Apr 9 |
140 |
$612/sf |
54 |
66 |
| Apr 16 |
146 |
$617/sf |
50 |
67 |
| Apr 23 |
149 |
$616/sf |
53 |
78 |
| Apr 30 |
152 |
$605/sf |
60 |
81 |
| May 7 |
157 |
$618/sf |
63 |
85 |
| May 14 |
158 |
$614/sf |
63 |
87 |
| May 21 |
154 |
$637/sf |
54 |
82 |
| May 28 |
146 |
$633/sf |
58 |
80 |
| Jun 4 |
149 |
$614/sf |
54 |
76 |
| Jun 11 |
158 |
$615/sf |
50 |
83 |
| Jun 18 |
164 |
$606/sf |
53 |
77 |
| Jun 25 |
160 |
$606/sf |
56 |
73 |
| Jul 2 |
160 |
$607/sf |
56 |
69 |
| Jul 9 |
160 |
$590/sf |
63 |
65 |
| Jul 16 |
160 |
$591/sf |
63 |
66 |
| Jul 23 |
156 |
$587/sf |
65 |
67 |
| Jul 30 |
158 |
$582/sf |
68 |
69 |
| Aug 6 |
165 |
$590/sf |
59 |
70 |
| Aug 13 |
166 |
$596/sf |
58 |
72 |
| Aug 20 |
172 |
$608/sf |
61 |
67 |
| Aug 27 |
171 |
$622/sf |
66 |
65 |
| Sep 3 |
172 |
$611/sf |
67 |
64 |
| Sep 10 |
176 |
$603/sf |
69 |
52 |
| Sep 17 |
177 |
$613/sf |
70 |
56 |
| Sep 24 |
174 |
$618/sf |
72 |
56 |
| Oct 1 |
164 |
$624/sf |
73 |
57 |
| Oct 8 |
169 |
$612/sf |
68 |
57 |
| Oct 15 |
174 |
$612/sf |
69 |
51 |
| Oct 22 |
171 |
$602/sf |
69 |
55 |
| Oct 29 |
159 |
$601/sf |
73 |
57 |
| Nov 5 |
158 |
$601/sf |
68 |
63 |
| Nov 12 |
157 |
$605/sf |
66 |
57 |
| Nov 19 |
147 |
$624/sf |
70 |
57 |
| Nov 26 |
141 |
$620/sf |
74 |
53 |
| Dec 3 |
131 |
$611/sf |
76 |
53 |
| Dec 10 |
127 |
$619/sf |
76 |
50 |
| Dec 17 |
118 |
$632/sf |
80 |
45 |
| Dec 24 |
109 |
$644/sf |
86 |
37 |
| Dec 31 |
104 |
$636/sf |
94 |
35 |
| Jan 7 |
108 |
$628/sf |
86 |
33 |
| Jan 14 |
107 |
$647/sf |
83 |
37 |
The $2,000,000+ Market:
| Date |
NSDCC Active Listings |
Avg. LP/sf |
Avg. DOM |
# of Pendings |
| Jan 1 |
341 |
$1,021/sf |
127 |
56 |
| Jan 8 |
356 |
$1,007/sf |
123 |
49 |
| Jan 15 |
370 |
$991/sf |
115 |
48 |
| Jan 22 |
375 |
$992/sf |
110 |
47 |
| Jan 29 |
384 |
$1,005/sf |
109 |
56 |
| Feb 5 |
387 |
$1,005/sf |
111 |
56 |
| Feb 12 |
379 |
$1,004/sf |
107 |
63 |
| Feb 19 |
399 |
$990/sf |
104 |
69 |
| Feb 26 |
400 |
$990/sf |
101 |
75 |
| Mar 5 |
398 |
$1,022/sf |
97 |
79 |
| Mar 12 |
406 |
$1,017/sf |
99 |
89 |
| Mar 19 |
430 |
$1,020/sf |
97 |
79 |
| Mar 26 |
455 |
$0/sf |
92 |
71 |
| Apr 2 |
453 |
$0/sf |
94 |
67 |
| Apr 9 |
462 |
$0/sf |
94 |
66 |
| Apr 16 |
473 |
$0/sf |
95 |
66 |
| Apr 23 |
482 |
$0/sf |
95 |
70 |
| Apr 30 |
476 |
$0/sf |
94 |
74 |
| May 7 |
486 |
$0/sf |
92 |
72 |
| May 14 |
493 |
$0/sf |
91 |
84 |
| May 21 |
510 |
$0/sf |
92 |
79 |
| May 28 |
504 |
$0/sf |
95 |
90 |
| Jun 4 |
488 |
$0/sf |
94 |
102 |
| Jun 11 |
502 |
$0/sf |
95 |
99 |
| Jun 18 |
524 |
$0/sf |
93 |
91 |
| Jun 25 |
525 |
$0/sf |
92 |
78 |
| Jul 2 |
516 |
$0/sf |
94 |
78 |
| Jul 9 |
519 |
$0/sf |
96 |
73 |
| Jul 16 |
521 |
$0/sf |
98 |
80 |
| Jul 23 |
539 |
$0/sf |
98 |
82 |
| Jul 30 |
550 |
$0/sf |
101 |
82 |
| Aug 6 |
544 |
$0/sf |
101 |
81 |
| Aug 13 |
556 |
$0/sf |
100 |
78 |
| Aug 20 |
562 |
$0/sf |
100 |
76 |
| Aug 27 |
552 |
$0/sf |
102 |
74 |
| Sep 3 |
541 |
$0/sf |
105 |
65 |
| Sep 10 |
543 |
$0/sf |
106 |
72 |
| Sep 17 |
550 |
$0/sf |
106 |
78 |
| Sep 24 |
545 |
$0/sf |
107 |
80 |
| Oct 1 |
528 |
$0/sf |
106 |
81 |
| Oct 8 |
523 |
$0/sf |
107 |
84 |
| Oct 15 |
523 |
$0/sf |
107 |
82 |
| Oct 22 |
528 |
$0/sf |
106 |
80 |
| Oct 29 |
523 |
$0/sf |
110 |
81 |
| Nov 5 |
505 |
$0/sf |
108 |
84 |
| Nov 12 |
503 |
$0/sf |
107 |
80 |
| Nov 19 |
500 |
$0/sf |
109 |
82 |
| Nov 26 |
502 |
$0/sf |
113 |
74 |
| Dec 3 |
489 |
$0/sf |
114 |
72 |
| Dec 10 |
498 |
$0/sf |
115 |
62 |
| Dec 17 |
473 |
$0/sf |
121 |
55 |
| Dec 24 |
443 |
$1,038/sf |
127 |
52 |
| Dec 31 |
417 |
$1,038/sf |
132 |
57 |
| Jan 7 |
398 |
$1,083/sf |
129 |
55 |
| Jan 14 |
402 |
$1,091/sf |
124 |
58 |
Weekly NSDCC New Listings and New Pendings
| Week |
New Listings |
New Pendings |
Total Pendings |
| Jan 1, 2018 |
18 |
15 |
| Jan 8 |
89 |
31 |
| Jan 15 |
87 |
43 |
| Jan 22 |
87 |
43 |
| Jan 29 |
81 |
48 |
244 |
| Feb 5 |
77 |
53 |
262 |
| Feb 12 |
74 |
53 |
280 |
| Feb 19 |
89 |
55 |
295 |
| Feb 26 |
87 |
57 |
318 |
| Mar 5 |
84 |
62 |
328 |
| Mar 12 |
107 |
61 |
339 |
| Mar 19 |
88 |
59 |
350 |
| Mar 26 |
99 |
55 |
347 |
| Apr 2 |
87 |
66 |
346 |
| Apr 9 |
106 |
58 |
336 |
| Apr 16 |
98 |
54 |
331 |
| Apr 23 |
108 |
67 |
353 |
| Apr 30 |
98 |
70 |
362 |
| May 7 |
138 |
68 |
355 |
| May 14 |
99 |
78 |
386 |
| May 21 |
115 |
63 |
369 |
| May 28 |
92 |
84 |
387 |
| Jun 4 |
91 |
77 |
410 |
| Jun 11 |
100 |
56 |
401 |
| Jun 18 |
103 |
54 |
376 |
| Jun 25 |
105 |
54 |
358 |
| Jul 2 |
83 |
78 |
361 |
| Jul 9 |
74 |
50 |
342 |
| Jul 16 |
109 |
83 |
361 |
| Jul 23 |
101 |
54 |
357 |
| Jul 30 |
97 |
67 |
364 |
| Aug 6 |
101 |
60 |
349 |
| Aug 13 |
103 |
54 |
350 |
| Aug 20 |
89 |
58 |
334 |
| Aug 27 |
83 |
46 |
325 |
| Sep 3 |
80 |
59 |
312 |
| Sep 10 |
83 |
46 |
302 |
| Sep 17 |
91 |
53 |
305 |
| Sep 24 |
85 |
41 |
296 |
| Oct 1 |
95 |
47 |
302 |
| Oct 8 |
93 |
55 |
307 |
| Oct 15 |
84 |
40 |
291 |
| Oct 22 |
101 |
51 |
298 |
| Oct 29 |
69 |
55 |
299 |
| Nov 5 |
75 |
49 |
293 |
| Nov 12 |
82 |
43 |
284 |
| Nov 19 |
59 |
42 |
282 |
| Nov 26 |
33 |
27 |
270 |
| Dec 3 |
67 |
45 |
264 |
| Dec 10 |
66 |
37 |
247 |
| Dec 17 |
34 |
37 |
231 |
| Dec 24 |
29 |
37 |
212 |
| Dec 31 |
12 |
20 |
211 |
| Jan 7, 2019 |
92 |
24 |
203 |
| Jan 14 |
81 |
35 |
205 |


Bill talks about the huge increase in for sale inventory in Las Vegas. I was there just a few weeks ago and I can tell you that the place is still booming there’s just no correlation at these low levels. We would have to see much more gross inventory not moving. Bill sees big percentage moves. I see historically low starting levels.