

Hat tip to daytrip who sent in this article on housing inventory growth, which appears to be growing nationwide, at least in the higher-end markets:
Homebuyers in the U.S. have plenty to grouse about these days. Prices have climbed steeply in many metro areas, mortgage rates are rising and inventory is thin. But for people looking to purchase their first home, it’s ugly out there.
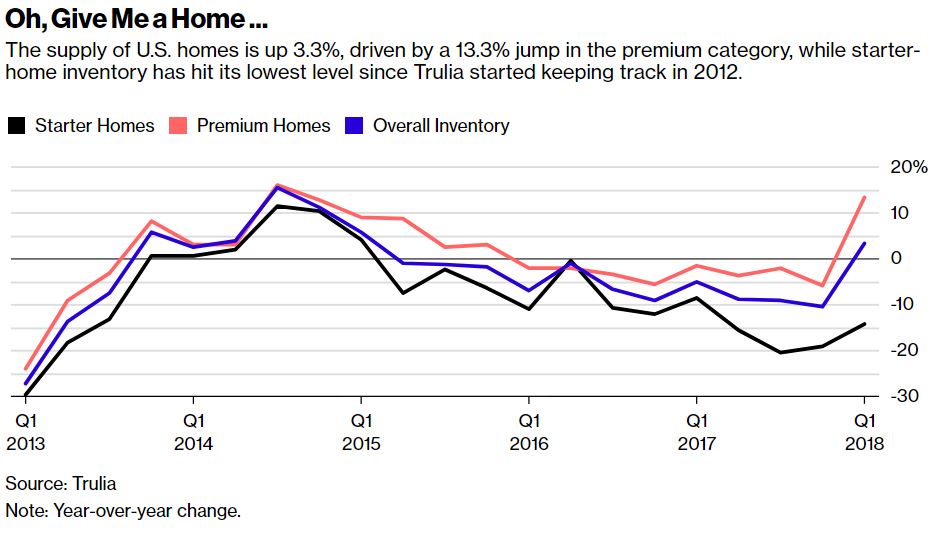
“Starter homes have become scarcer, pricier, smaller, older and more likely in need of some TLC” than they were six years ago, the real estate website Trulia reported Wednesday after analyzing housing stock across the country. Trulia began tracking prices and inventory in 2012.
It’s grim all over. American homes are at their least affordable in the report’s history. But the median listing price of available starter homes has risen 9.6 percent in the past year, easily beating out the trade-up and premium categories, while starter-home supply has fallen to a new low this quarter, Trulia reported.
How are we doing locally?
Here are the number of new listings between Carlsbad and La Jolla that hit the MLS between January 1st and March 15th – there will be a few stragglers to add to this year’s count:
NSDCC Detached-Home Listings Between Jan 1 – March 15
| Price Range | |||
| Under $1M | |||
| $1M to $1.5M | |||
| $1.5M to $2M | |||
| Over $2M | |||
| Totals | |||
| Closed Sales |
If there were some breakout numbers here, I’d be concerned that a flood of inventory could cool off the market quickly. The only thing close is the $2M+ inventory being 10% higher than last year – but it’s less than 2016, and prices have gone up since then, so not a big deal.
The lower-end listings have really dried up – houses for sale that are listed under $1,000,000 have shrunk 39% since 2016.


This is weird. Just before I read your post, I read this one on Calculated Risk about home inventories being DOWN 8% year-year. ??
The info is from different sources (Trulia vs National Association of Realtors), but you wouldn’t expect that big a difference.
Calculated Risk (click on the 2nd chart for inventory – not pretty!):
http://www.calculatedriskblog.com/2018/03/nar-existing-home-sales-rebound-30.html
Speaking of older homes, what was Jim’s rule of thumb regarding the average monthly upkeep expense of homes that are over 35 years old, and how does that formula extend to apartment buildings, per unit? I know Jim posted something on the subject awhile back. Can’t remember off the top of my head…