

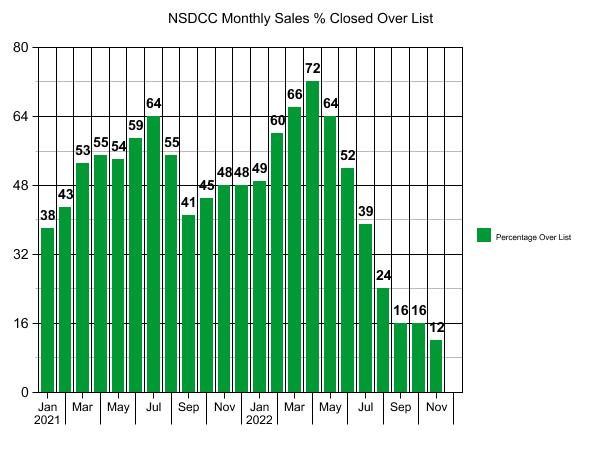
Only 12% of the houses sold last month actually closed over their list price, which sounds normal.
There were 51 of the 115 of the sales (44%) that closed for $100,000+ BELOW their last list price.
The count of 51 broke down to 17 of 19 sales over $3,000,000, and 34 of 96 sales under $3,000,000 – where knocking off $100,000+ off the list price is fairly significant. Either realtors aren’t that great about their pricing, or they wander into lowball territory and get their head tore off.
The median days-on-market was 28 days, and the average was 41 days.
About half wandered into lowball territory, and about half sold for $100,000+ below their list price – there is a direct connection. People need to figure out how to sell the house in the first couple of weeks of being on the market, or face the same consequences in 2023.
~~~~~~~~~~~~~~~~~~~~~~~~~~~~~~~~~~~~~~~~~~~~~~~
NSDCC Average and Median Prices by Month
| Month | |||||
| Feb | |||||
| March | |||||
| April | |||||
| May | |||||
| June | |||||
| July | |||||
| Aug | |||||
| Sept | |||||
| Oct | |||||
| Nov | |||||
| Dec | |||||
| Jan | |||||
| Feb | |||||
| Mar | |||||
| Apr | |||||
| May | |||||
| Jun | |||||
| Jul | |||||
| Aug | |||||
| Sep | |||||
| Oct | |||||
| Nov |
In October, when the average and median sales price spiked, it didn’t mean your home’s value went up – the homes sold that month had a median square footage that was 12% higher than in September. Similarly, the group of homes that sold in November had a median sf that was 8% smaller than in October.
But if you do want to make a big deal of these sales prices, they are similar to those in July, 2021.
At least there were 100+ sales!


0 Comments