It’s obvious this year that the market is tough and sellers aren’t able to demand everything they want like before.
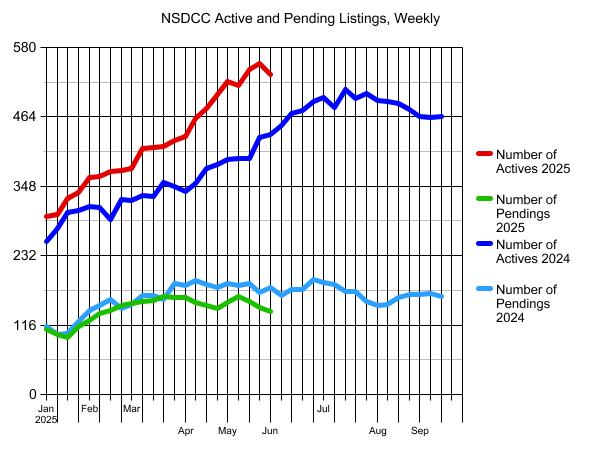
It will probably cause more sellers to cancel sooner, and others to not try at all. The inventory count may hover around 500-ish for a couple of more weeks but the inventory should taper off earlier than usual this year.
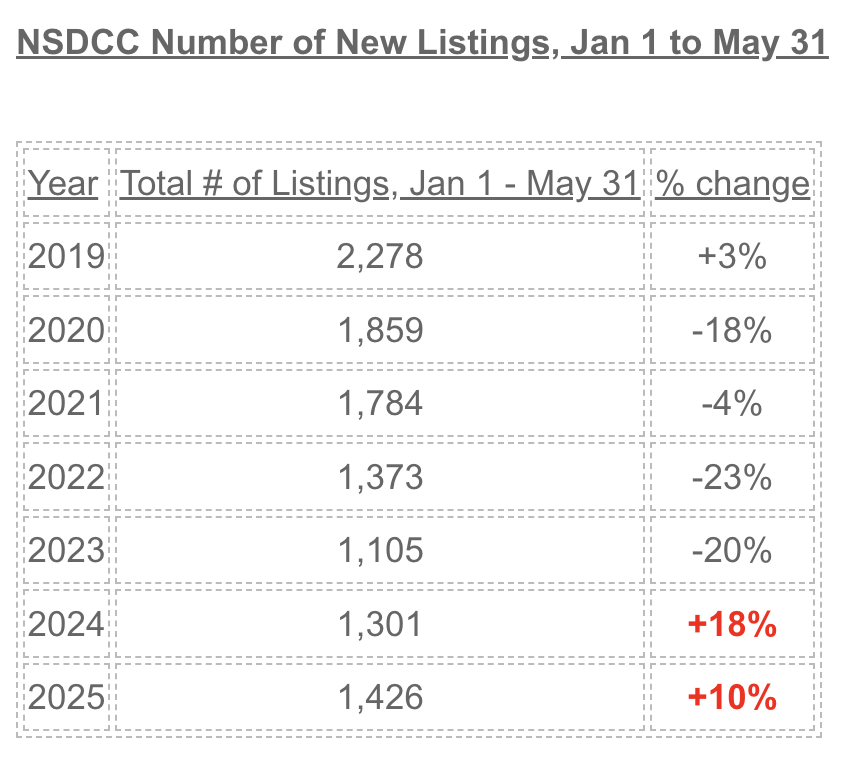
The problem hasn’t been an overwhelming surge in inventory. The problem is that there aren’t enough coming out the other end. NSDCC sales are 5% higher than last year for the Jan 1 to May 31 period. But, combined with the hangover of the 2024 unsold listings, the excess unsolds this year have been piling up.
Sellers will quit, rather than suffer the indignation of having to adjust on price.
I think we’ve seen peak inventory this year.
The $0 – $2,000,000 Market:
| Date |
NSDCC Active Listings |
Avg. LP/sf |
Avg. DOM |
# of Pendings |
| Jan 6, 2025 |
43 |
$918/sf |
63 |
27 |
| Jan 13 |
45 |
$936/sf |
53 |
22 |
| Jan 20 |
47 |
$908/sf |
54 |
25 |
| Jan 27 |
48 |
$904/sf |
48 |
32 |
| Feb 3 |
51 |
$914/sf |
47 |
41 |
| Feb 10 |
45 |
$935/sf |
46 |
45 |
| Feb 17 |
45 |
$916/sf |
46 |
46 |
| Feb 24 |
45 |
$958/sf |
48 |
40 |
| Mar 3 |
50 |
$950/sf |
37 |
42 |
| Mar 10 |
55 |
$908/sf |
36 |
45 |
| Mar 17 |
53 |
$891/sf |
35 |
50 |
| Mar 24 |
53 |
$898/sf |
30 |
51 |
| Mar 31 |
58 |
$878/sf |
35 |
44 |
| Apr 7 |
56 |
$867/sf |
30 |
43 |
| Apr 14 |
63 |
$906/sf |
32 |
40 |
| Apr 21 |
59 |
$936/sf |
35 |
37 |
| Apr 28 |
74 |
$899/sf |
32 |
39 |
| May 5 |
83 |
$907/sf |
30 |
47 |
| May 12 |
72 |
$916/sf |
34 |
44 |
| May 19 |
70 |
$898/sf |
38 |
51 |
| May 26 |
74 |
$923/sf |
39 |
43 |
| Jun 2 |
76 |
$912/sf |
39 |
36 |
The $2,000,000 – $3,000,000 Market:
| Date |
NSDCC Active Listings |
Avg. LP/sf |
Avg. DOM |
# of Pendings |
| Jan 6, 2025 |
55 |
$1,029/sf |
66 |
36 |
| Jan 13 |
58 |
$990/sf |
63 |
31 |
| Jan 20 |
64 |
$1,018/sf |
57 |
26 |
| Jan 27 |
64 |
$1,025/sf |
53 |
31 |
| Feb 3 |
71 |
$1,009/sf |
50 |
31 |
| Feb 10 |
75 |
$1,005/sf |
46 |
36 |
| Feb 17 |
81 |
$1,015/sf |
44 |
39 |
| Feb 24 |
80 |
$1,012/sf |
38 |
52 |
| Mar 3 |
80 |
$1,034/sf |
33 |
49 |
| Mar 10 |
92 |
$1,029/sf |
37 |
44 |
| Mar 17 |
98 |
$1,015/sf |
39 |
44 |
| Mar 24 |
98 |
$1,008/sf |
41 |
52 |
| Mar 31 |
100 |
$997/sf |
44 |
54 |
| Apr 7 |
94 |
$940/sf |
43 |
54 |
| Apr 14 |
96 |
$962/sf |
42 |
53 |
| Apr 21 |
107 |
$1,000/sf |
43 |
53 |
| Apr 28 |
109 |
$1,010/sf |
44 |
49 |
| May 5 |
124 |
$1,036/sf |
40 |
50 |
| May 12 |
120 |
$1,041/sf |
43 |
57 |
| May 19 |
133 |
$1,034/sf |
43 |
49 |
| May 26 |
133 |
$1,055/sf |
47 |
53 |
| Jun 2 |
140 |
$1,039/sf |
48 |
51 |
The $3,000,000 – $4,000,000 Market:
| Date |
NSDCC Active Listings |
Avg. LP/sf |
Avg. DOM |
# of Pendings |
| Jan 6, 2025 |
44 |
$1,091/sf |
82 |
19 |
| Jan 13 |
46 |
$1,122/sf |
77 |
19 |
| Jan 20 |
52 |
$1,156/sf |
70 |
16 |
| Jan 27 |
49 |
$1,197/sf |
67 |
20 |
| Feb 3 |
56 |
$1,182/sf |
55 |
21 |
| Feb 10 |
58 |
$1,158/sf |
51 |
25 |
| Feb 17 |
58 |
$1,179/sf |
54 |
24 |
| Feb 24 |
56 |
$1,168/sf |
52 |
24 |
| Mar 3 |
51 |
$1,147/sf |
56 |
31 |
| Mar 10 |
56 |
$1,240/sf |
61 |
34 |
| Mar 17 |
60 |
$1,209/sf |
61 |
36 |
| Mar 24 |
60 |
$1,209/sf |
62 |
39 |
| Mar 31 |
62 |
$1,158/sf |
64 |
34 |
| Apr 7 |
68 |
$1,208/sf |
59 |
34 |
| Apr 14 |
79 |
$1,193/sf |
55 |
26 |
| Apr 21 |
85 |
$1,230/sf |
54 |
28 |
| Apr 28 |
85 |
$1,198/sf |
53 |
28 |
| May 5 |
82 |
$1,179/sf |
56 |
28 |
| May 12 |
89 |
$1,148/sf |
53 |
30 |
| May 19 |
88 |
$1,161/sf |
56 |
28 |
| May 26 |
85 |
$1,157/sf |
58 |
26 |
| Jun 2 |
81 |
$1,162/sf |
58 |
22 |
The $4,000,000+ Market:
| Date |
NSDCC Active Listings |
Avg. LP/sf |
Avg. DOM |
# of Pendings |
| Jan 6, 2025 |
160 |
$1,822/sf |
105 |
27 |
| Jan 13 |
156 |
$1,868/sf |
105 |
31 |
| Jan 20 |
170 |
$1,936/sf |
95 |
29 |
| Jan 27 |
180 |
$1,877/sf |
90 |
31 |
| Feb 3 |
189 |
$1,884/sf |
85 |
31 |
| Feb 10 |
189 |
$1,864/sf |
88 |
29 |
| Feb 17 |
192 |
$1,875/sf |
90 |
32 |
| Feb 24 |
195 |
$1,869/sf |
91 |
34 |
| Mar 3 |
200 |
$1,860/sf |
87 |
34 |
| Mar 10 |
213 |
$1,811/sf |
83 |
36 |
| Mar 17 |
208 |
$1,755/sf |
85 |
30 |
| Mar 24 |
211 |
$1,800/sf |
86 |
25 |
| Mar 31 |
213 |
$1,784/sf |
90 |
32 |
| Apr 7 |
219 |
$1,777/sf |
90 |
33 |
| Apr 14 |
230 |
$1,790/sf |
87 |
35 |
| Apr 21 |
231 |
$1,792/sf |
87 |
32 |
| Apr 28 |
235 |
$1,772/sf |
88 |
28 |
| May 5 |
239 |
$1,811/sf |
82 |
30 |
| May 12 |
239 |
$1,811/sf |
85 |
33 |
| May 19 |
255 |
$1,773/sf |
85 |
29 |
| May 26 |
265 |
$1,759/sf |
87 |
24 |
| Jun 2 |
242 |
$1,745/sf |
90 |
29 |
NSDCC Weekly New Listings and New Pendings
| Week |
New Listings |
New Pendings |
Total Actives |
Total Pendings |
| Jan 6 |
27 |
11 |
298 |
108 |
| Jan 13 |
38 |
26 |
301 |
101 |
| Jan 20 |
55 |
16 |
328 |
95 |
| Jan 27 |
60 |
32 |
337 |
113 |
| Feb 3 |
72 |
28 |
363 |
123 |
| Feb 10 |
50 |
34 |
364 |
135 |
| Feb 17 |
50 |
29 |
373 |
140 |
| Feb 24 |
58 |
38 |
374 |
148 |
| Mar 3 |
60 |
31 |
378 |
152 |
| Mar 10 |
60 |
30 |
411 |
156 |
| Mar 17 |
49 |
37 |
413 |
157 |
| Mar 24 |
57 |
39 |
414 |
164 |
| Mar 31 |
47 |
27 |
425 |
162 |
| Apr 7 |
52 |
31 |
431 |
162 |
| Apr 14 |
70 |
28 |
462 |
153 |
| Apr 21 |
58 |
24 |
478 |
148 |
| Apr 28 |
71 |
30 |
501 |
143 |
| May 5 |
82 |
37 |
524 |
154 |
| May 12 |
56 |
39 |
516 |
163 |
| May 19 |
54 |
20 |
543 |
156 |
| May 26 |
58 |
29 |
554 |
146 |
| Jun 2 |
41 |
22 |
535 |
138 |
NSDCC List Price Quartiles
| Week |
1st Quartile |
Median List Price |
3rd Quartile |
| Jan 6 |
$2,685,000 |
$4,472,500 |
$7,995,000 |
| Jan 13 |
$2,499,000 |
$4,250,000 |
$7,750,000 |
| Jan 20 |
$2,695,000 |
$4,300,000 |
$7,767,000 |
| Jan 27 |
$2,795,000 |
$4,498,000 |
$7,995,000 |
| Feb 3 |
$2,695,000 |
$4,350,000 |
$7,499,000 |
| Feb 10 |
$2,799,000 |
$4,299,000 |
$7,695,000 |
| Feb 17 |
$2,695,000 |
$4,200,000 |
$7,750,000 |
| Feb 24 |
$2,699,500 |
$4,250,000 |
$7,645,000 |
| Mar 3 |
$2,550,000 |
$4,375,000 |
$7,497,000 |
| Mar 10 |
$2,500,000 |
$4,200,000 |
$7,250,000 |
| Mar 17 |
$2,500,000 |
$4,000,000 |
$6,995,000 |
| Mar 24 |
$2,595,000 |
$4,047,500 |
$7,275,000 |
| Mar 31 |
$2,499,000 |
$4,000,000 |
$7,300,000 |
| Apr 7 |
$2,500,000 |
$4,000,000 |
$6,995,000 |
| Apr 14 |
$2,500,000 |
$3,999,000 |
$6,995,000 |
| Apr 21 |
$2,590,000 |
$3,995,000 |
$6,799,500 |
| Apr 28 |
$2,490,000 |
$3,988,000 |
$6,500,000 |
| May 5 |
$2,395,000 |
$3,795,000 |
$6,495,000 |
| May 12 |
$2,495,000 |
$3,895,000 |
$6,500,000 |
| May 19 |
$2,495,000 |
$3,950,000 |
$6,595,000 |
| May 26 |
$2,495,000 |
$3,984,500 |
$6,547,500 |
| Jun 2 |
$2,395,000 |
$3,799,000 |
$6,295,500 |


The Fed is going to be forced to lower interest rates soon. Keeping interest rates high might be a FU to Trump but its entirely killed inflation which he’s now highlighting as a win. A 2 point decrease would make sales go crazy but I dont think it would push up prices because theres a glut of inventory and people are nervous about investing.
Shadash, the most you can expect is 50bps by October. Either 25bps Sept & Oct or 50bps in October. The Fed has earned its reputation for too little, too late. And as you note any sooner looks (to them) like caving to Trump.
In their (weak) defense inflation remains a concern.