

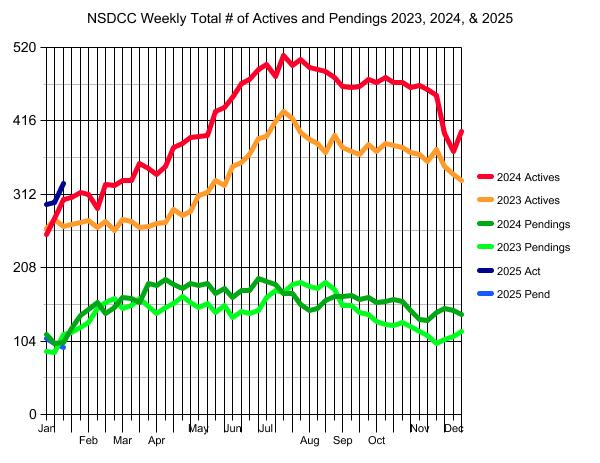
The number of homes for sale has already exceeded the counts for the same time in 2023 and 2024, and the number of pendings is lower than the previous two years too.
The pendings’ count has dipped 10% since the start of the year, but it did the same thing last year before turning upward. Their blue line is barely visible on the chart because it is so similar to last year.
There have been 119 new listings in January, so 300+ looks achievable!
The guy who has been studying the homes-for-sale inventory closer than anyone
The $0 – $2,000,000 Market:
| Date | ||||
| Jan 6, 2025 | ||||
| Jan 13 | ||||
| Jan 20 |
The $2,000,000 – $3,000,000 Market:
| Date | ||||
| Jan 6, 2025 | ||||
| Jan 13 | ||||
| Jan 20 |
The $3,000,000 – $4,000,000 Market:
| Date | ||||
| Jan 6, 2025 | ||||
| Jan 13 | ||||
| Jan 20 |
The $4,000,000+ Market:
| Date | ||||
| Jan 6, 2025 | ||||
| Jan 13 | ||||
| Jan 20 |
NSDCC Weekly New Listings and New Pendings
| Week | ||||
| Jan 6 | ||||
| Jan 13 | ||||
| Jan 20 |
NSDCC List Price Quartiles
| Week | |||
| Jan 6 | |||
| Jan 13 | |||
| Jan 20 |


I know I’m strange for putting so much into quartiles but look here. A firm bottom and little midriff spread. If anything a bit top heavy but getting in shape which few would consider a bad thing.
Yes, I am going to hell for the bad bad analogy.
The markewt is adjusting without any direction. Good.
Can’t blame people for being optimistic.
In 2024, there were 31 NSDCC sales over $10 million.
There are 51 active listings over $10 million!