

On December 9th, there were 401 active listings bertween La Jolla and Carlsbad.
Today there are 298 actives.
It would be natural to think that the reason the count dropped so much was that sellers were cancelling their listings in preparation for a new approach in 2025.
Get this – there have been 77 new pendings since December 9th – wow! In December, 2023 there were 78 NSDCC sales, and last month there were 133 sales – a 71% increase year-over-year!
I’m convinced there will be a surge of inventory this year, but if it were to stay under control, we might have a real frenzy on our hands. Especially if sellers can be reasonable about their list price.
Before the pandemic, there were always 500-1,000 active listings laying around. Will buyers ignore the recent ultra-low inventory counts and be happy to have more homes to consider – and not get intimidated by a bigger group of actives?
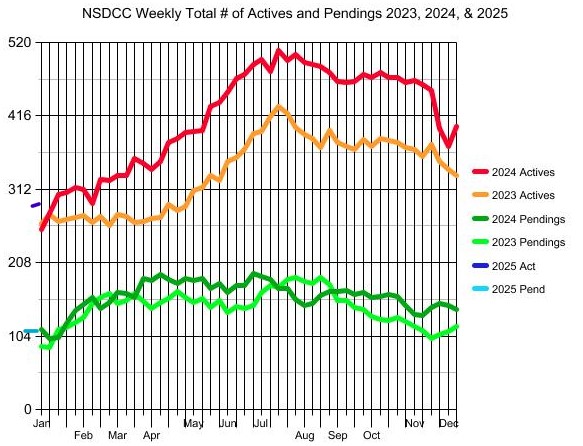
It looks like the count of NSDCC active listings will reach 400+ next month. Here is the recent history of when we reached 400 actives during the Covid years:
2024: Mid-May
2023: Early July
2022: Mid-June
2021: Never
As long as buyers don’t mind seeing the inventory count growing faster than it did in recent history, we could see frenzy-like conditions shortly.
Housekeeping: As of today, I have changed back to using the SDAR MLS. The north-county CRMLS insisted that realtors sign a very restrictive policy about how we use the MLS data, and I couldn’t go for it.
The difference on the blog is how the two companies classify house sales. The CRMLS for north county calls them SFRs, and a few agents load their attached homes or PUDs into the MLS and call them SFRs. The choice at SDAR is simple choice – either detached or attached. As a result, there are 11 fewer actives in SDAR today than there are in CRMLS.
One other minor thing. This blog can no longer be accessed while outside the United States (I don’t think). There is too much garbage going on behind the scenes and we are trying to clean it out to improve the speed. Let me know if you have any insights!
The $0 – $2,000,000 Market:
| Date | ||||
| Jan 6, 2025 |
The $2,000,000 – $3,000,000 Market:
| Date | ||||
| Jan 6, 2025 |
The $3,000,000 – $4,000,000 Market:
| Date | ||||
| Jan 6, 2025 |
The $4,000,000+ Market:
| Date | ||||
| Jan 6, 2025 |
NSDCC Weekly New Listings and New Pendings
| Week | ||||
| Jan 6 |
NSDCC List Price Quartiles
| Week | |||
| Jan 6 |


0 Comments