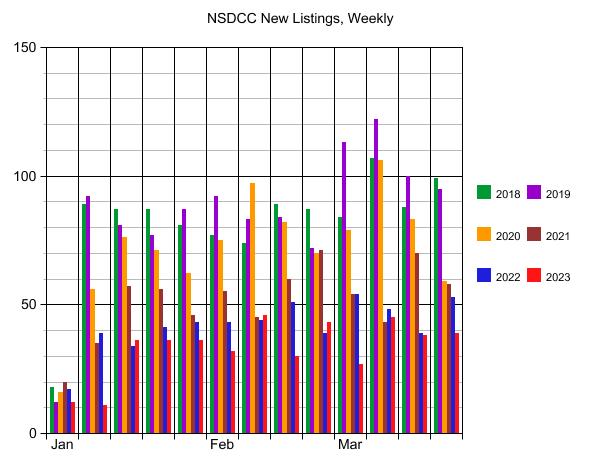
Until there is a significant increase in inventory, we won’t know how the current market conditions are affecting the demand, if at all. I thought we’d get off to a sluggish start, but this is shockingly low:
Total NSDCC Detached-Home Listings, First 13 Readings of the Year
2018: 1,067
2019: 1,110
2020: 932
2021: 670
2022: 545
2023: 431
This is how the new listings look on a weekly basis:
Mortgae rates have improved considerably, and now buyers can get a rate in the fives, instead of the sevens, which sounds attractive. But if there aren’t enough quality listings, who cares?
Lower rates should mean that buyers can get a little more for their money, but sellers want to squeeze some of that benefit too:
More listings are needed – let’s go sellers!
The $0 – $1,500,000 Market:
| Date |
NSDCC Active Listings |
Avg. LP/sf |
Avg. DOM |
# of Pendings |
| Jan 2, 2023 |
22 |
$719/sf |
75 |
15 |
| Jan 9 |
26 |
$687/sf |
50 |
14 |
| Jan 16 |
23 |
$701/sf |
52 |
20 |
| Jan 23 |
25 |
$751/sf |
60 |
21 |
| Jan 30 |
23 |
$788/sf |
45 |
25 |
| Feb 6 |
18 |
$750/sf |
59 |
24 |
| Feb 13 |
18 |
$770/sf |
48 |
26 |
| Feb 20 |
17 |
$778/sf |
49 |
26 |
| Feb 27 |
18 |
$802/sf |
48 |
23 |
| Mar 6 |
22 |
$802/sf |
44 |
14 |
| Mar 13 |
22 |
$747/sf |
45 |
16 |
| Mar 20 |
16 |
$826/sf |
49 |
21 |
The $1,500,000 – $2,000,000 Market:
| Date |
NSDCC Active Listings |
Avg. LP/sf |
Avg. DOM |
# of Pendings |
| Jan 2, 2023 |
45 |
$809/sf |
60 |
18 |
| Jan 9 |
55 |
$828/sf |
53 |
19 |
| Jan 16 |
46 |
$838/sf |
53 |
30 |
| Jan 23 |
43 |
$793/sf |
52 |
31 |
| Jan 30 |
40 |
$778/sf |
54 |
34 |
| Feb 6 |
42 |
$814/sf |
46 |
30 |
| Feb 13 |
35 |
$823/sf |
51 |
39 |
| Feb 20 |
34 |
$801/sf |
47 |
40 |
| Feb 27 |
27 |
$846/sf |
33 |
45 |
| Mar 6 |
29 |
$893/sf |
33 |
41 |
| Mar 13 |
32 |
$850/sf |
33 |
39 |
| Mar 20 |
27 |
$872/sf |
36 |
41 |
The $2,000,000 – $3,000,000 Market:
| Date |
NSDCC Active Listings |
Avg. LP/sf |
Avg. DOM |
# of Pendings |
| Jan 2, 2023 |
52 |
$869/sf |
69 |
30 |
| Jan 9 |
57 |
$940/sf |
66 |
31 |
| Jan 16 |
50 |
$948/sf |
61 |
36 |
| Jan 23 |
51 |
$949/sf |
58 |
35 |
| Jan 30 |
54 |
$964/sf |
55 |
34 |
| Feb 6 |
60 |
$930/sf |
51 |
42 |
| Feb 13 |
51 |
$1,038/sf |
52 |
47 |
| Feb 20 |
58 |
$1,022/sf |
47 |
46 |
| Feb 27 |
56 |
$1,064/sf |
52 |
49 |
| Mar 6 |
57 |
$995/sf |
50 |
50 |
| Mar 13 |
55 |
$1,015/sf |
53 |
47 |
| Mar 20 |
50 |
$1,011/sf |
58 |
50 |
The $3,000,000 – $4,000,000 Market:
| Date |
NSDCC Active Listings |
Avg. LP/sf |
Avg. DOM |
# of Pendings |
| Jan 2, 2023 |
29 |
$1,236/sf |
85 |
6 |
| Jan 9 |
29 |
$1,180/sf |
80 |
5 |
| Jan 16 |
31 |
$1,196/sf |
73 |
8 |
| Jan 23 |
33 |
$1,201/sf |
71 |
7 |
| Jan 30 |
37 |
$1,218/sf |
70 |
6 |
| Feb 6 |
34 |
$1,236/sf |
75 |
12 |
| Feb 13 |
43 |
$1,333/sf |
68 |
11 |
| Feb 20 |
39 |
$1,392/sf |
71 |
18 |
| Feb 27 |
37 |
$1,323/sf |
68 |
22 |
| Mar 6 |
49 |
$1,222/sf |
56 |
20 |
| Mar 13 |
49 |
$1,312/sf |
49 |
22 |
| Mar 20 |
46 |
$1,321/sf |
52 |
25 |
The $4,000,000+ Market:
| Date |
NSDCC Active Listings |
Avg. LP/sf |
Avg. DOM |
# of Pendings |
| Jan 2, 2023 |
121 |
$1,744/sf |
126 |
21 |
| Jan 9 |
119 |
$1,716/sf |
123 |
20 |
| Jan 16 |
120 |
$1,761/sf |
121 |
26 |
| Jan 23 |
122 |
$1,707/sf |
119 |
27 |
| Jan 30 |
120 |
$1,680/sf |
121 |
30 |
| Feb 6 |
125 |
$1,714/sf |
118 |
28 |
| Feb 13 |
121 |
$1,750/sf |
116 |
32 |
| Feb 20 |
129 |
$1,725/sf |
112 |
33 |
| Feb 27 |
124 |
$1,743/sf |
115 |
31 |
| Mar 6 |
122 |
$1,753/sf |
109 |
28 |
| Mar 13 |
120 |
$1,782/sf |
109 |
32 |
| Mar 20 |
129 |
$1,783/sf |
106 |
28 |
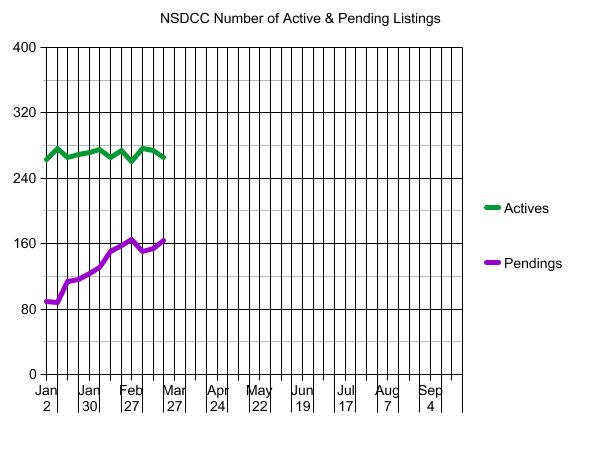
NSDCC Weekly New Listings and New Pendings
| Week |
New Listings |
New Pendings |
Total Actives |
Total Pendings |
| Jan 2, 2023 |
11 |
6 |
263 |
89 |
| Jan 9 |
36 |
15 |
277 |
88 |
| Jan 16 |
36 |
34 |
266 |
114 |
| Jan 23 |
36 |
22 |
269 |
116 |
| Jan 30 |
32 |
25 |
272 |
123 |
| Feb 6 |
46 |
33 |
275 |
131 |
| Feb 13 |
30 |
35 |
265 |
150 |
| Feb 20 |
43 |
34 |
274 |
158 |
| Feb 27 |
27 |
30 |
260 |
165 |
| Mar 6 |
45 |
28 |
276 |
150 |
| Mar 13 |
38 |
38 |
274 |
154 |
| Mar 20 |
39 |
37 |
265 |
164 |
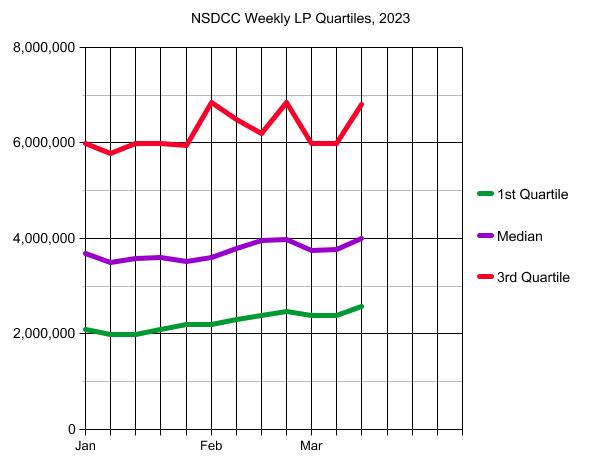
NSDCC Weekly LP Quartiles
| Week |
1st Quartile |
2nd Quartile (Median LP) |
3rd Quartile |
| Jan 2, 2023 |
$2,095,000 |
$3,695,000 |
$5,995,000 |
| Jan 9 |
$1,990,000 |
$3,495,000 |
$5,775,000 |
| Jan 16 |
$2,000,000 |
$3,574,000 |
$5,995,000 |
| Jan 23 |
$2,099,000 |
$3,595,000 |
$5,999,000 |
| Jan 30 |
$2,195,000 |
$3,525,000 |
$5,942,000 |
| Feb 6 |
$2,195,000 |
$3,598,000 |
$6,845,000 |
| Feb 13 |
$2,300,000 |
$3,795,000 |
$6,495,000 |
| Feb 20 |
$2,397,500 |
$3,950,000 |
$6,197,500 |
| Feb 27 |
$2,480,800 |
$3,970,000 |
$6,845,000 |
| Mar 6 |
$2,395,000 |
$3,749,500 |
$5,995,000 |
| Mar 13 |
$2,397,000 |
$3,772,500 |
$5,997,000 |
| Mar 20 |
$2,580,000 |
$3,995,000 |
$6,800,000 |


Today there are 92 NSDCC homes for sale priced over $5,000,000, and 39 of those are priced over $10,000,000!
These updates are great, thanks! If you have the energy, it would be great to duplicate the first chart and exclude $3m+ (which is relevant to very few readers). As you know, the chart looks very different and is quite interesting, showing the evolution from a 2:1 actives to listing ratio to falling below 1:1.
I agree – the Under-$3,000,000 market is really cooking.
The raw data can be found at the bottom of the post each Monday. I have the energy! 😆