

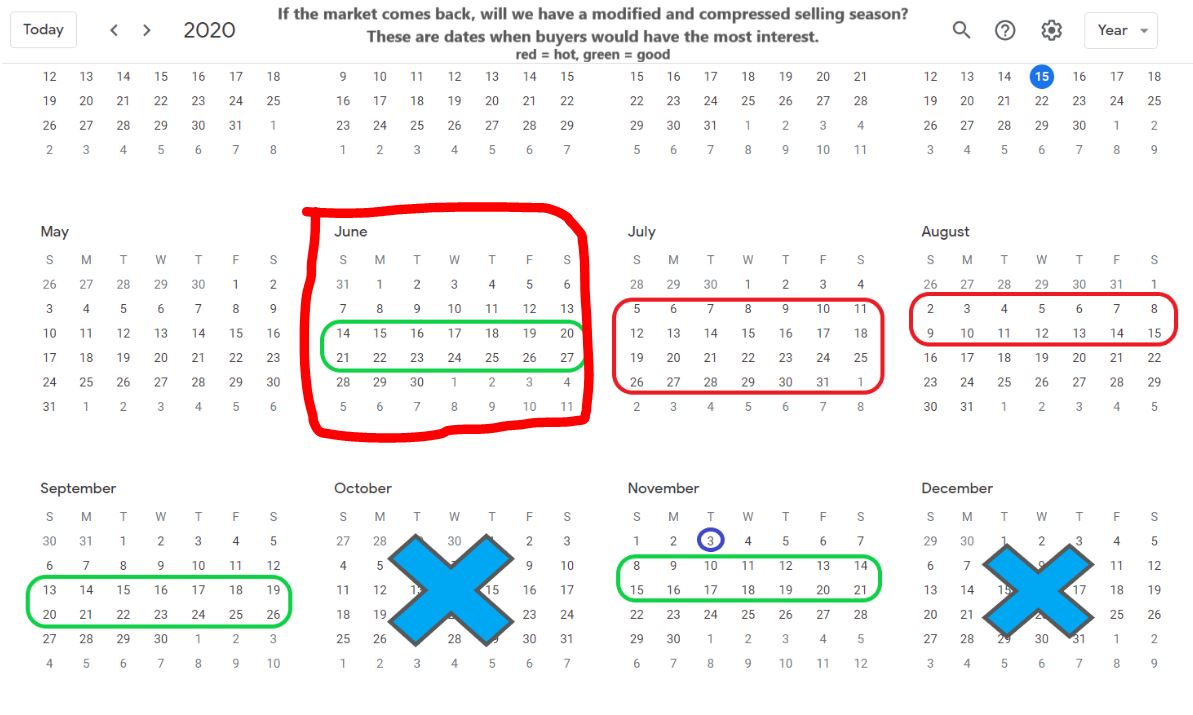
It was on April 15th that I drew up the calendar above, and then I added the additional red box around June when it was becoming obvious by the end of May that the market was taking off.
June, July, and August were all dead-red-full-tilt-boogie, then we had a blip around Labor Day/heat stroke/schooling, and we’re back to a healthy-hot market. The green = good description (at the top of chart) is about right – but it could be red hot if we just had more inventory.
While we’re due for a cooling off, but the October market could be better than expected if sellers get the memo that there are buyers starved for quality homes to purchase. I’m sticking with the November flurry right after election day too, figuring that realtors will want to get in one more sale before Christmas.


0 Comments