

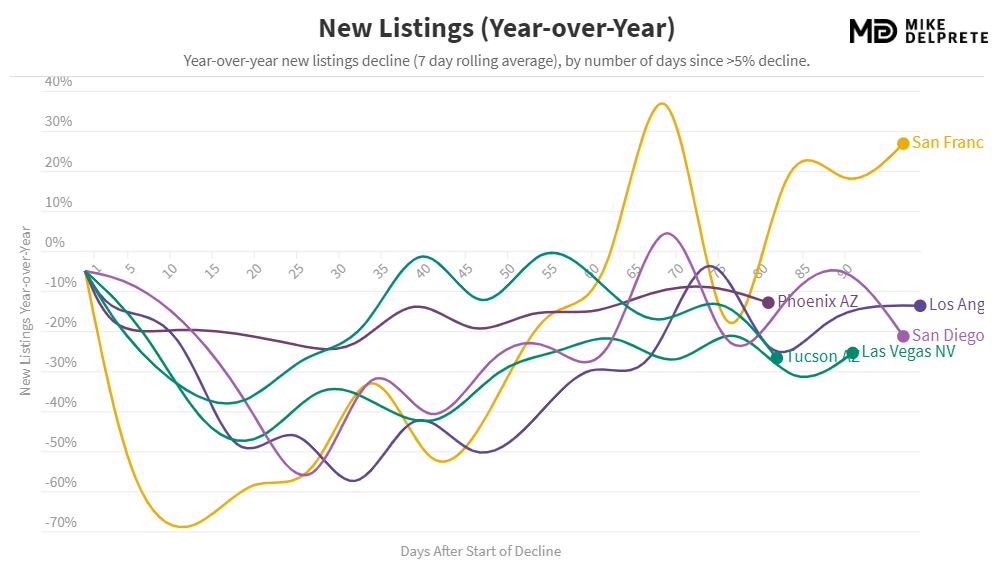
The New Listings graph (above) shows how the raw number of homes listed for sale in the coronavirus era compares to the same time frame in 2019.
It shows that 40-50 days after the initial shock, sellers started feeling more comfortable putting their home on the market, and for the last twenty days, San Diego has only been 5% to 21% behind last year.
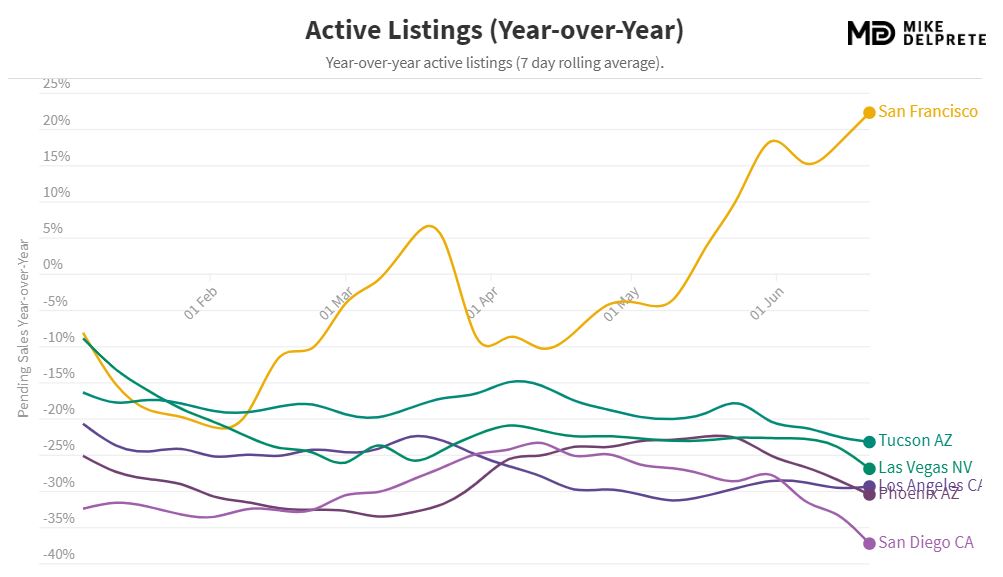
The graph below helps to demonstrate the supply vs. demand relationship year-over-year, and it’s helpful to call these Unsold Listings because they are the net outcome (Supply – Demand = Unsold Listings).
If we were running at the same pace as in 2019, and the demand percentage had dropped the same as supply, then our Unsold Listings would simply be the same 5% to 21% lower than last year. But our number of Unsold Listings are now 37% below last year – the best in the southwest!
Lower inventory, record-low rates, and the insanity are causing demand to surge!
Thanks Mike!


0 Comments