Yesterday’s Zillow index showed San Diego’s pricing to be fairly flat, and now April’s Case-Shiller Index has a similar-sounding +0.8% increase year-over-year.
We’ve bounced back from six months of negative readings, just to get back to where we were last year – and we’re still not as high as the June and July 2018 readings:
San Diego Non-Seasonally-Adjusted CSI changes:
| Observation Month | |||
| January ’18 | |||
| February | |||
| March | |||
| April | |||
| May | |||
| Jun | |||
| Jul | |||
| Aug | |||
| Sept | |||
| Oct | |||
| Nov | |||
| Dec | |||
| January ’19 | |||
| Feb | |||
| Mar | |||
| Apr |
The high-tier index is similar with just a +0.5% increase over last April, and not as high as June, 2018:
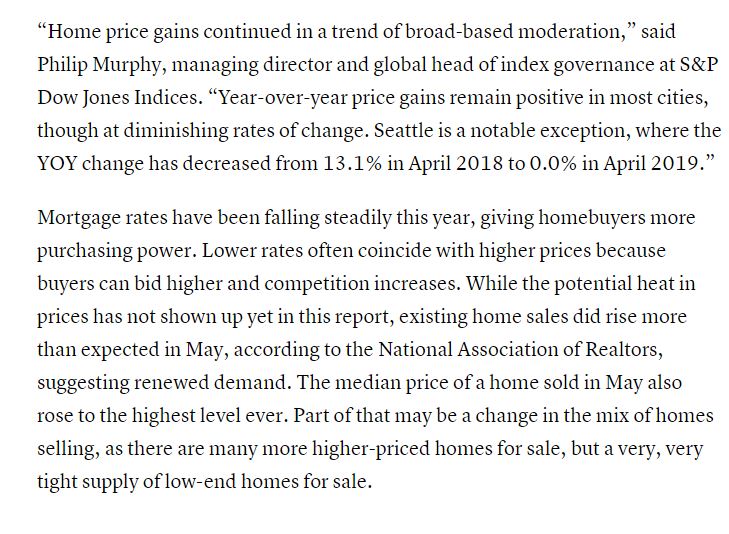
From cnbc:


Given the recent return of ultra low rates, prices merely flat is worrisome. If there’s an interest rate “spike” all the way up close to historic lows we could see the market (volume and prices) fall out of bed.