

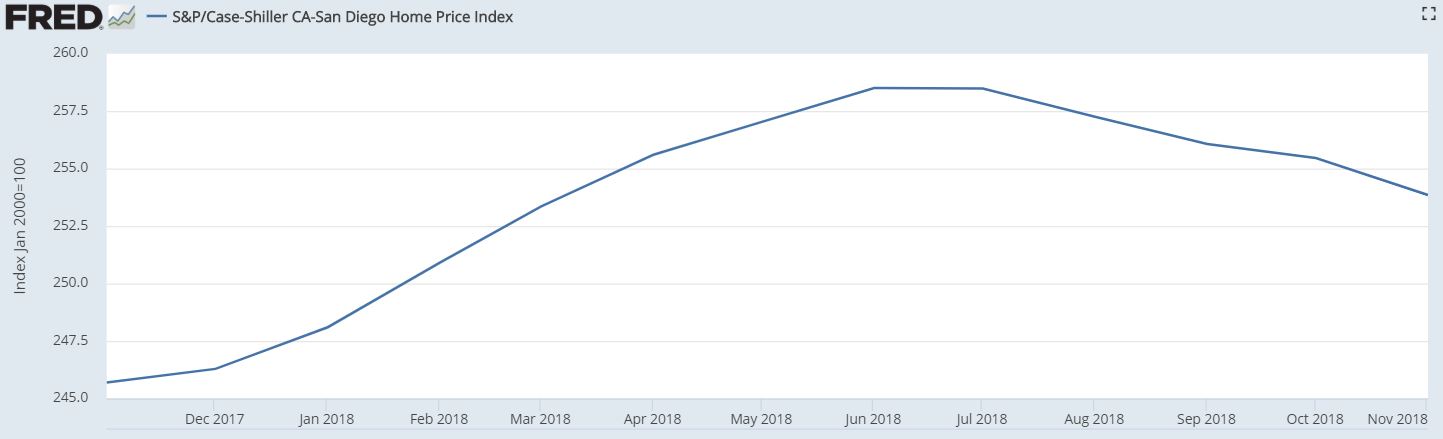
The non-seasonally-adjusted San Diego Case-Shiller Index dropped again in November, which seems like 100 years ago now that we’re rolling into February. A couple of notes:
- If you like your data processed and refined, the seasonally-adjusted index has been flat the last four months. I like mine raw and uncooked.
- They revise these numbers slightly every month.
We are roughly back to where we were in March. You could make the case that the better-quality homes sell for a premium during the selling season while the others wait, and then some of those go for a slight discount in the off-season. It might be the pattern for every year, going forward.
San Diego Non-Seasonally-Adjusted CSI changes:
| Reporting Month | |||
| January ’17 | |||
| February | |||
| March | |||
| April | |||
| May | |||
| June | |||
| Jul | |||
| Aug | |||
| Sept | |||
| Oct | |||
| Nov | |||
| Dec | |||
| January ’18 | |||
| February | |||
| March | |||
| April | |||
| May | |||
| Jun | |||
| Jul | |||
| Aug | |||
| Sept | |||
| Oct | |||
| Nov |
The previous peak was 250.34 in November, 2005.


0 Comments