

The non-seasonally-adjusted San Diego Case-Shiller Index had another strong reading for April, setting a new all-time high!
San Diego Non-Seasonally-Adjusted CSI changes:
| January ’17 | |||
| February | |||
| March | |||
| April | |||
| May | |||
| June | |||
| Jul | |||
| Aug | |||
| Sept | |||
| Oct | |||
| Nov | |||
| Dec | |||
| January ’18 | |||
| February | |||
| March | |||
| April |
The previous peak was 250.34 in November, 2005. We are 2% above that now, thanks to inflation. This year is starting off much like 2017, and we can probably expect the SDCSI to cool down in the second half of the year.
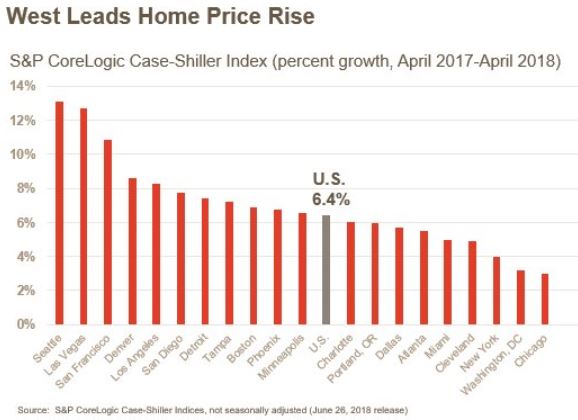
“Home prices continued their climb,” said David M. Blitzer, managing director and chairman of the Index Committee at S&P Dow Jones Indices. “Cities west of the Rocky Mountains continue to lead price increases with Seattle, Las Vegas, and San Francisco ranking 1-2-3 based on price movements in the trailing 12 months. The favorable economy and moderate mortgage rates both support recent gains in housing.”
“However, if one adjusts the price movements for inflation since 2006, a very different picture emerges,” noted Blitzer. “Only three cities – Dallas, Denver, and Seattle – are ahead in real, or inflation-adjusted, terms. The National Index is 14 percent below its boom-time peak and Las Vegas, the city with the longest road to a new high, is 47 percent below its peak when inflation is factored in.”


Re: Jim’s tweet linking the article claiming 4 year college isn’t worth the money…
If it’s Harvard or Yale, and your kid has the brain for it, and his/her major is related to a real job, it’s still a bargain, and the best life move you can make at that age.
That’s also why no famous blues singer has ever come from Harvard or Yale.
Think about that for a minute, I beseech ye.