Many years ago, we purchased a home in Carlsbad, using a realtor that was recommended to us - Jim Klinge. Fast forward to 2025, we recently had the privilege of selling 2 homes in Carlsbad, CA and didn't hesitate to reach out to Jim and Donna Klinge of Klinge Realty Group to guide us through the sales. The transactions were very different, each with its own unique situation, opportunities and challenges. From start to finish, Donna and Jim helped navigate the pre-sale preparation, the listing, showing of the house, buyer negotiations, the final close and all of the paperwork and decisions in between. What stands out with both transactions is the professionalism of Jim and Donna (and their team), wonderful communication (timely, relevant, concise), their deep understanding of market dynamics (setting realistic expectations), their access to top-notch contractors, and last, their ability to guide us across the finish line successfully. We wouldn't hesitate to use Jim and Donna in the future and highly recommend them for anyone looking to buy or sell a property in North San Diego County.


with no signs of slowing down either!
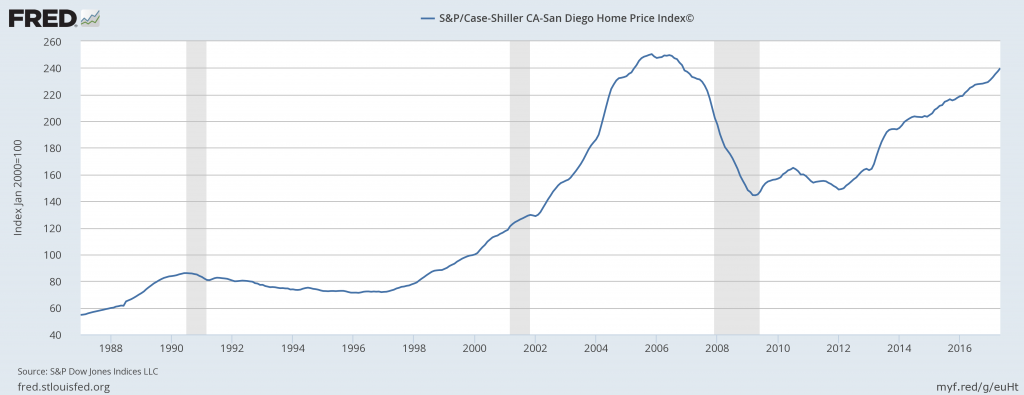
San Diego politicians are all in agreement that there is a housing “crisis” that only they can solve. Combine that with all the news regarding rising rents to boot.
Other experts agree the rising home prices do not point to a bubble.
“Now, the one complicating factor is the mortgage interest deduction, which makes housing in the 80s look less affordable than it really was,” said Brent Nyitray, iServe Residential Lending director of capital markets. “Taxes were higher, and interest as a percentage of the P&I payment was higher, so the differences are somewhat exaggerated.”
“However, it does appear that buying a house is not as ‘unaffordable’ as the median house price to median income ratio implies,” Nyitray said. “Just remember these graphs when you hear people discussing how high real estate prices are and that we are in another bubble. We aren’t.”
The 10-City Composite also increased, rising 4.9% from last year. This increase is down from the 5% annual increase in April. Before seasonal adjustment, the 10-City Composite increased 0.7%, however after seasonal adjustment it showed no increase.
Similarly, the 20-City Composite increased 5.7% in May from last year, down from April’s annual increase of 5.8%. It increased 0.8% before seasonal adjustment, but only 0.1% after the adjustment. All top 20 cities in the U.S. reported increases before seasonal adjustment, and after seasonal adjustment 14 cities saw monthly price increases in May.