

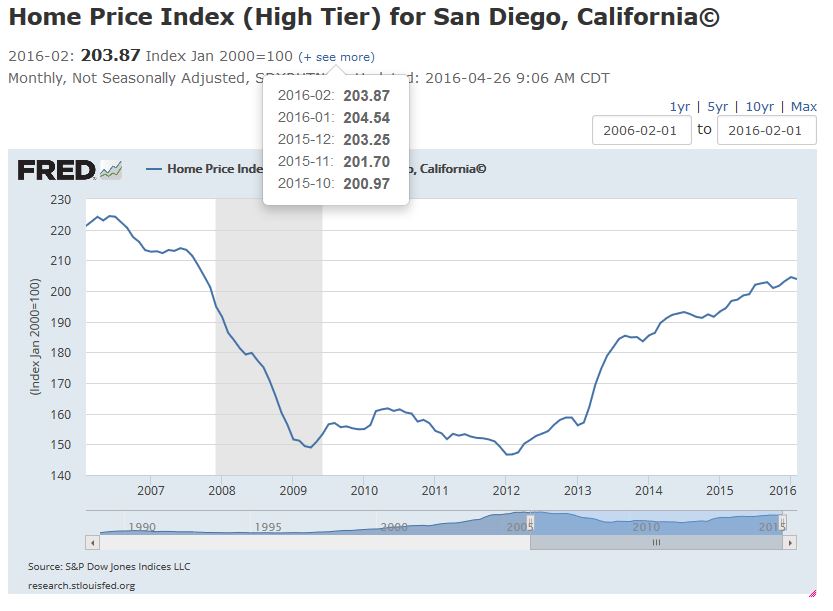
February’s Case-Shiller Index for San Diego rose by 0.1% over January. Our average of +0.3% per month over the last six months is probably what we can expect for the rest of the year, with the next couple of months being elevated (like in 2015) due to the ‘season’.
But the higher-end market dropped 0.3%, and with 459 active listings of NSDCC houses priced over $2,400,000, it’s a buyer’s market there. We could see more pricing turbulence on the high-end before the year is out.
Here are the San Diego NSA changes:
| Month | |||
| December | |||
| January ’15 | |||
| February | |||
| March | |||
| April | |||
| May | |||
| June | |||
| July | |||
| August | |||
| September | |||
| October | |||
| November | |||
| December | |||
| January ’16 | |||
| February |


0 Comments