

Hunch: ‘Rebalancing’ might take longer than expected.
Executive Summary
San Diego housing market exhibits a pronounced -2.38% YoY price decline with 3,245 unit surplus inventory, creating a buyer-favorable landscape with 29.6% of listings showing price cuts (+50.3% YoY) – significantly outpacing the national increase of 17.4%. Market segments reveal contrasting realities with strategic pockets of opportunity.
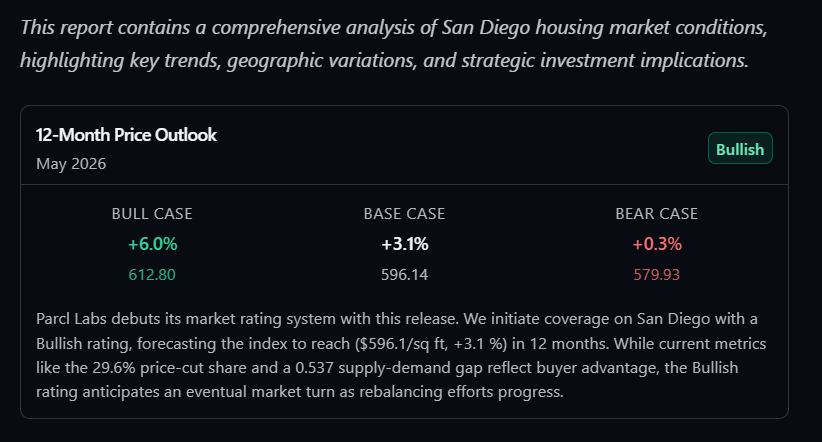
Rating and 12-Month Price Forecast: Parcl Labs initiates coverage of San Diego with a Bullish rating, forecasting a 12-month price of ($596.1/sq ft, +3.1%) – just clearing our 3% threshold for a bullish designation. While a 29.6% price-cut share currently indicates buyer leverage, this Bullish outlook anticipates a market shift, supported by ongoing rebalancing. We will review this forecast if current headwinds persist.
San Diego’s absorption rate has fallen to 0.482 as supply (6,262 units) substantially outpaces demand (3,017 units), creating a 0.537 supply-demand gap – significantly wider than the national gap of 0.326. Price cuts have reached a 12-month high at 29.6%, signaling accelerating market rebalancing.
Extreme submarket divergence exists with premium ZIP 92129 showing severe correction signals (supply +137.5% YoY, prices -9.0% YoY) while Imperial County demonstrates robust appreciation (+41.5% YoY) against San Diego County’s -1.1% YoY price decline.
ZIP-level data exposes the most pronounced correction signals in premium neighborhoods, with ZIP 92129 registering a 137.5% supply increase against a 7.0% demand decline, creating a 144.5% market gap that has driven prices down 9.0% year-over-year to $1,351,000. This premium market deterioration contrasts sharply with pockets of resilient demand in ZIPs 92117, 92114, and 92056, which registered exceptional transaction growth of 28.4%, 19.8%, and 15.1% respectively. These localized demand growth areas represent tactical opportunity zones for investors seeking counter-cyclical appreciation potential amid the broader market deceleration, highlighting the importance of granular sub-market analysis in the current transitional environment.
Mid-market property segments command significant yield premiums over luxury (Mid-Century Starter: 5.28%, 1980s Suburban: 5.17% vs. Luxury Estate: 3.64%), with Vintage Family homes showing persistent buyer advantage (supply-demand gap: 0.1203) as other segments approach equilibrium.
We really should break down every sub-market.


Listings in premium zips will continue to rise as demographics see elderly owners ageing out of their homes. Their heirs are unlikely to be able/willing to purchase the home out of the estate resulting in a steady supply of inventory.