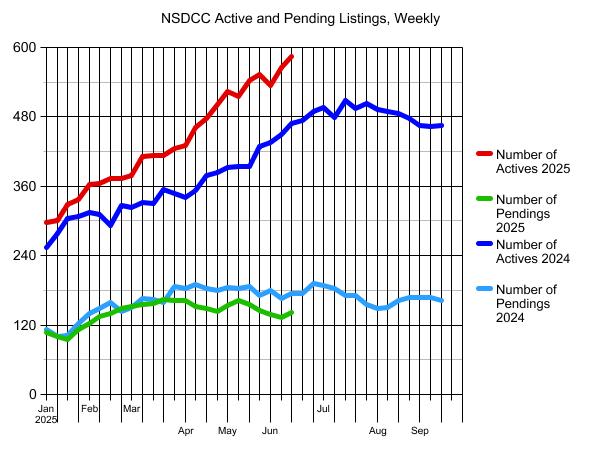
The number of homes for sale between La Jolla and Carlsbad is 15% above the highest count in 2024 – which was in mid-July.
Where will we be next month?
I thought many would be giving up by now, but instead more are pushing to get out. Are they aware of the difficulty, and that half won’t be selling this year?
The $0 – $2,000,000 Market:
| Date |
NSDCC Active Listings |
Avg. LP/sf |
Avg. DOM |
# of Pendings |
| Jan 6, 2025 |
43 |
$918/sf |
63 |
27 |
| Jan 13 |
45 |
$936/sf |
53 |
22 |
| Jan 20 |
47 |
$908/sf |
54 |
25 |
| Jan 27 |
48 |
$904/sf |
48 |
32 |
| Feb 3 |
51 |
$914/sf |
47 |
41 |
| Feb 10 |
45 |
$935/sf |
46 |
45 |
| Feb 17 |
45 |
$916/sf |
46 |
46 |
| Feb 24 |
45 |
$958/sf |
48 |
40 |
| Mar 3 |
50 |
$950/sf |
37 |
42 |
| Mar 10 |
55 |
$908/sf |
36 |
45 |
| Mar 17 |
53 |
$891/sf |
35 |
50 |
| Mar 24 |
53 |
$898/sf |
30 |
51 |
| Mar 31 |
58 |
$878/sf |
35 |
44 |
| Apr 7 |
56 |
$867/sf |
30 |
43 |
| Apr 14 |
63 |
$906/sf |
32 |
40 |
| Apr 21 |
59 |
$936/sf |
35 |
37 |
| Apr 28 |
74 |
$899/sf |
32 |
39 |
| May 5 |
83 |
$907/sf |
30 |
47 |
| May 12 |
72 |
$916/sf |
34 |
44 |
| May 19 |
70 |
$898/sf |
38 |
51 |
| May 26 |
74 |
$923/sf |
39 |
43 |
| Jun 2 |
76 |
$912/sf |
39 |
36 |
| Jun 9 |
87 |
$939/sf |
38 |
36 |
| Jun 16 |
83 |
$922/sf |
41 |
48 |
The $2,000,000 – $3,000,000 Market:
| Date |
NSDCC Active Listings |
Avg. LP/sf |
Avg. DOM |
# of Pendings |
| Jan 6, 2025 |
55 |
$1,029/sf |
66 |
36 |
| Jan 13 |
58 |
$990/sf |
63 |
31 |
| Jan 20 |
64 |
$1,018/sf |
57 |
26 |
| Jan 27 |
64 |
$1,025/sf |
53 |
31 |
| Feb 3 |
71 |
$1,009/sf |
50 |
31 |
| Feb 10 |
75 |
$1,005/sf |
46 |
36 |
| Feb 17 |
81 |
$1,015/sf |
44 |
39 |
| Feb 24 |
80 |
$1,012/sf |
38 |
52 |
| Mar 3 |
80 |
$1,034/sf |
33 |
49 |
| Mar 10 |
92 |
$1,029/sf |
37 |
44 |
| Mar 17 |
98 |
$1,015/sf |
39 |
44 |
| Mar 24 |
98 |
$1,008/sf |
41 |
52 |
| Mar 31 |
100 |
$997/sf |
44 |
54 |
| Apr 7 |
94 |
$940/sf |
43 |
54 |
| Apr 14 |
96 |
$962/sf |
42 |
53 |
| Apr 21 |
107 |
$1,000/sf |
43 |
53 |
| Apr 28 |
109 |
$1,010/sf |
44 |
49 |
| May 5 |
124 |
$1,036/sf |
40 |
50 |
| May 12 |
120 |
$1,041/sf |
43 |
57 |
| May 19 |
133 |
$1,034/sf |
43 |
49 |
| May 26 |
133 |
$1,055/sf |
47 |
53 |
| Jun 2 |
140 |
$1,039/sf |
48 |
51 |
| Jun 9 |
149 |
$1,042/sf |
45 |
45 |
| Jun 16 |
157 |
$1,043/sf |
46 |
44 |
The $3,000,000 – $4,000,000 Market:
| Date |
NSDCC Active Listings |
Avg. LP/sf |
Avg. DOM |
# of Pendings |
| Jan 6, 2025 |
44 |
$1,091/sf |
82 |
19 |
| Jan 13 |
46 |
$1,122/sf |
77 |
19 |
| Jan 20 |
52 |
$1,156/sf |
70 |
16 |
| Jan 27 |
49 |
$1,197/sf |
67 |
20 |
| Feb 3 |
56 |
$1,182/sf |
55 |
21 |
| Feb 10 |
58 |
$1,158/sf |
51 |
25 |
| Feb 17 |
58 |
$1,179/sf |
54 |
24 |
| Feb 24 |
56 |
$1,168/sf |
52 |
24 |
| Mar 3 |
51 |
$1,147/sf |
56 |
31 |
| Mar 10 |
56 |
$1,240/sf |
61 |
34 |
| Mar 17 |
60 |
$1,209/sf |
61 |
36 |
| Mar 24 |
60 |
$1,209/sf |
62 |
39 |
| Mar 31 |
62 |
$1,158/sf |
64 |
34 |
| Apr 7 |
68 |
$1,208/sf |
59 |
34 |
| Apr 14 |
79 |
$1,193/sf |
55 |
26 |
| Apr 21 |
85 |
$1,230/sf |
54 |
28 |
| Apr 28 |
85 |
$1,198/sf |
53 |
28 |
| May 5 |
82 |
$1,179/sf |
56 |
28 |
| May 12 |
89 |
$1,148/sf |
53 |
30 |
| May 19 |
88 |
$1,161/sf |
56 |
28 |
| May 26 |
85 |
$1,157/sf |
58 |
26 |
| Jun 2 |
81 |
$1,162/sf |
58 |
22 |
| Jun 9 |
89 |
$1,146/sf |
58 |
21 |
| Jun 16 |
95 |
$1,107/sf |
56 |
17 |
The $4,000,000+ Market:
| Date |
NSDCC Active Listings |
Avg. LP/sf |
Avg. DOM |
# of Pendings |
| Jan 6, 2025 |
160 |
$1,822/sf |
105 |
27 |
| Jan 13 |
156 |
$1,868/sf |
105 |
31 |
| Jan 20 |
170 |
$1,936/sf |
95 |
29 |
| Jan 27 |
180 |
$1,877/sf |
90 |
31 |
| Feb 3 |
189 |
$1,884/sf |
85 |
31 |
| Feb 10 |
189 |
$1,864/sf |
88 |
29 |
| Feb 17 |
192 |
$1,875/sf |
90 |
32 |
| Feb 24 |
195 |
$1,869/sf |
91 |
34 |
| Mar 3 |
200 |
$1,860/sf |
87 |
34 |
| Mar 10 |
213 |
$1,811/sf |
83 |
36 |
| Mar 17 |
208 |
$1,755/sf |
85 |
30 |
| Mar 24 |
211 |
$1,800/sf |
86 |
25 |
| Mar 31 |
213 |
$1,784/sf |
90 |
32 |
| Apr 7 |
219 |
$1,777/sf |
90 |
33 |
| Apr 14 |
230 |
$1,790/sf |
87 |
35 |
| Apr 21 |
231 |
$1,792/sf |
87 |
32 |
| Apr 28 |
235 |
$1,772/sf |
88 |
28 |
| May 5 |
239 |
$1,811/sf |
82 |
30 |
| May 12 |
239 |
$1,811/sf |
85 |
33 |
| May 19 |
255 |
$1,773/sf |
85 |
29 |
| May 26 |
265 |
$1,759/sf |
87 |
24 |
| Jun 2 |
242 |
$1,745/sf |
90 |
29 |
| Jun 9 |
244 |
$1,774/sf |
90 |
33 |
| Jun 16 |
254 |
$1,766/sf |
88 |
34 |
NSDCC Weekly New Listings and New Pendings
| Week |
New Listings |
New Pendings |
Total Actives |
Total Pendings |
| Jan 6 |
27 |
11 |
298 |
108 |
| Jan 13 |
38 |
26 |
301 |
101 |
| Jan 20 |
55 |
16 |
328 |
95 |
| Jan 27 |
60 |
32 |
337 |
113 |
| Feb 3 |
72 |
28 |
363 |
123 |
| Feb 10 |
50 |
34 |
364 |
135 |
| Feb 17 |
50 |
29 |
373 |
140 |
| Feb 24 |
58 |
38 |
374 |
148 |
| Mar 3 |
60 |
31 |
378 |
152 |
| Mar 10 |
60 |
30 |
411 |
156 |
| Mar 17 |
49 |
37 |
413 |
157 |
| Mar 24 |
57 |
39 |
414 |
164 |
| Mar 31 |
47 |
27 |
425 |
162 |
| Apr 7 |
52 |
31 |
431 |
162 |
| Apr 14 |
70 |
28 |
462 |
153 |
| Apr 21 |
58 |
24 |
478 |
148 |
| Apr 28 |
71 |
30 |
501 |
143 |
| May 5 |
82 |
37 |
524 |
154 |
| May 12 |
56 |
39 |
516 |
163 |
| May 19 |
54 |
20 |
543 |
156 |
| May 26 |
58 |
29 |
554 |
146 |
| Jun 2 |
41 |
22 |
535 |
138 |
| Jun 9 |
62 |
25 |
566 |
134 |
| Jun 16 |
68 |
32 |
585 |
142 |
NSDCC List Price Quartiles
| Week |
1st Quartile |
Median List Price |
3rd Quartile |
| Jan 6 |
$2,685,000 |
$4,472,500 |
$7,995,000 |
| Jan 13 |
$2,499,000 |
$4,250,000 |
$7,750,000 |
| Jan 20 |
$2,695,000 |
$4,300,000 |
$7,767,000 |
| Jan 27 |
$2,795,000 |
$4,498,000 |
$7,995,000 |
| Feb 3 |
$2,695,000 |
$4,350,000 |
$7,499,000 |
| Feb 10 |
$2,799,000 |
$4,299,000 |
$7,695,000 |
| Feb 17 |
$2,695,000 |
$4,200,000 |
$7,750,000 |
| Feb 24 |
$2,699,500 |
$4,250,000 |
$7,645,000 |
| Mar 3 |
$2,550,000 |
$4,375,000 |
$7,497,000 |
| Mar 10 |
$2,500,000 |
$4,200,000 |
$7,250,000 |
| Mar 17 |
$2,500,000 |
$4,000,000 |
$6,995,000 |
| Mar 24 |
$2,595,000 |
$4,047,500 |
$7,275,000 |
| Mar 31 |
$2,499,000 |
$4,000,000 |
$7,300,000 |
| Apr 7 |
$2,500,000 |
$4,000,000 |
$6,995,000 |
| Apr 14 |
$2,500,000 |
$3,999,000 |
$6,995,000 |
| Apr 21 |
$2,590,000 |
$3,995,000 |
$6,799,500 |
| Apr 28 |
$2,490,000 |
$3,988,000 |
$6,500,000 |
| May 5 |
$2,395,000 |
$3,795,000 |
$6,495,000 |
| May 12 |
$2,495,000 |
$3,895,000 |
$6,500,000 |
| May 19 |
$2,495,000 |
$3,950,000 |
$6,595,000 |
| May 26 |
$2,495,000 |
$3,984,500 |
$6,547,500 |
| Jun 2 |
$2,395,000 |
$3,799,000 |
$6,295,500 |
| Jun 9 |
$2,300,000 |
$3,649,000 |
$5,998,500 |
| Jun 16 |
$2,395,000 |
$3,649,000 |
$5,999,000 |


I love the smell of napalm in the morning, things are unraveling, long overdue. Let’s hope banks don’t get bailed out this time. But I highly doubt it. We will get stuck with the bill again.
Too much equity out there to worry about bailouts.
But if those equity positions were to evaporate before sellers can unload, it will be Fannie/Freddie that gets hit – just when there is talk about them going private!
We know there is no such thing as “private” since 2008 Jim.
The buck always stops with the taxpayers.
Direct bailouts or stealth inflation, we are going to pay for it, big boys always win.