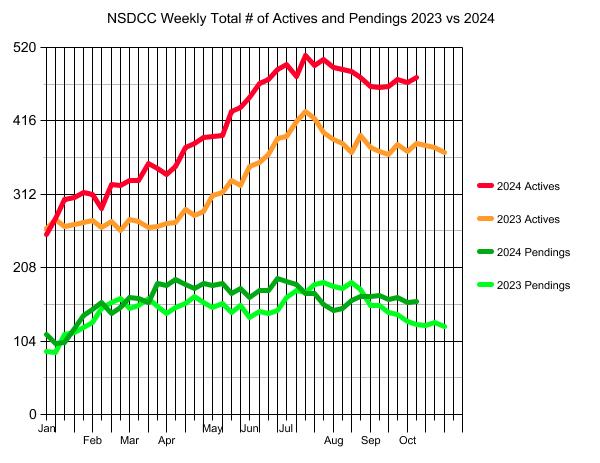
Even though there were 28 sales closed in the last week, the pendings count went UP!
There are still deals happening this close to Election Day.
Here’s how the active listings compare to the same week last year:
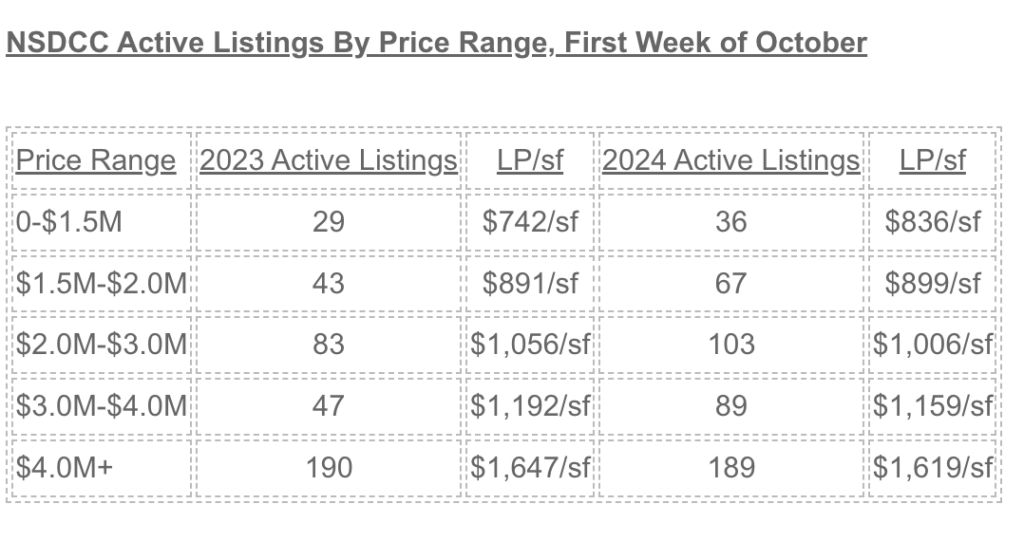
Fairly similar numbers to those in October, 2023!
But get this. The median list price of the active listings:
October, 2023: $3,999,450
October, 2024: $3,490,000 (-$509,450)
Get Good Help!
The $0 – $1,500,000 Market:
| Date |
NSDCC Active Listings |
Avg. LP/sf |
Avg. DOM |
# of Pendings |
| Jan 2, 2024 |
15 |
$724/sf |
49 |
23 |
| Jan 8 |
13 |
$645/sf |
58 |
19 |
| Jan 15 |
10 |
$664/sf |
55 |
15 |
| Jan 22 |
15 |
$750/sf |
36 |
15 |
| Jan 29 |
12 |
$834/sf |
36 |
21 |
| Feb 5 |
12 |
$784/sf |
38 |
23 |
| Feb 12 |
10 |
$818/sf |
30 |
22 |
| Feb 19 |
12 |
$731/sf |
17 |
21 |
| Feb 26 |
7 |
$725/sf |
26 |
21 |
| Mar 4 |
9 |
$763/sf |
23 |
21 |
| Mar 11 |
15 |
$742/sf |
14 |
17 |
| Mar 18 |
15 |
$697/sf |
16 |
21 |
| Mar 25 |
13 |
$846/sf |
19 |
22 |
| Apr 1 |
12 |
$897/sf |
22 |
20 |
| Apr 8 |
15 |
$869/sf |
37 |
22 |
| Apr 15 |
17 |
$811/sf |
16 |
25 |
| Apr 22 |
18 |
$829/sf |
16 |
23 |
| Apr 29 |
20 |
$796/sf |
20 |
23 |
| May 6 |
19 |
$868/sf |
18 |
23 |
| May 13 |
21 |
$859/sf |
18 |
22 |
| May 20 |
25 |
$939/sf |
20 |
18 |
| May 27 |
24 |
$897/sf |
25 |
20 |
| Jun 3 |
22 |
$879/sf |
25 |
19 |
| Jun 10 |
25 |
$834/sf |
26 |
19 |
| Jun 17 |
21 |
$823/sf |
31 |
21 |
| Jun 24 |
24 |
$752/sf |
32 |
24 |
| Jul 1 |
23 |
$760/sf |
44 |
26 |
| Jul 8 |
22 |
$801/sf |
40 |
23 |
| Jul 15 |
22 |
$815/sf |
36 |
23 |
| Jul 22 |
17 |
$814/sf |
43 |
23 |
| Jul 29 |
24 |
$815/sf |
33 |
14 |
| Aug 5 |
23 |
$771/sf |
29 |
18 |
| Aug 12 |
22 |
$787/sf |
36 |
23 |
| Aug 19 |
24 |
$773/sf |
28 |
27 |
| Aug 26 |
24 |
$760/sf |
27 |
24 |
| Sep 2 |
28 |
$767/sf |
24 |
18 |
| Sep 9 |
27 |
$803/sf |
28 |
21 |
| Sep 16 |
32 |
$808/sf |
27 |
19 |
| Sep 23 |
37 |
$791/sf |
24 |
17 |
| Sep 30 |
31 |
$892/sf |
29 |
23 |
| Oct 7 |
36 |
$836/sf |
28 |
18 |
The $1,500,000 – $2,000,000 Market:
| Date |
NSDCC Active Listings |
Avg. LP/sf |
Avg. DOM |
# of Pendings |
| Jan 2, 2024 |
20 |
$866/sf |
66 |
28 |
| Jan 8 |
23 |
$890/sf |
63 |
23 |
| Jan 15 |
32 |
$876/sf |
47 |
35 |
| Jan 22 |
35 |
$823/sf |
43 |
25 |
| Jan 29 |
38 |
$833/sf |
43 |
26 |
| Feb 5 |
39 |
$810/sf |
34 |
28 |
| Feb 12 |
32 |
$781/sf |
39 |
34 |
| Feb 19 |
33 |
$797/sf |
36 |
29 |
| Feb 26 |
33 |
$840/sf |
36 |
31 |
| Mar 4 |
39 |
$827/sf |
32 |
31 |
| Mar 11 |
30 |
$857/sf |
43 |
37 |
| Mar 18 |
34 |
$847/sf |
36 |
37 |
| Mar 25 |
34 |
$848/sf |
43 |
43 |
| Apr 1 |
23 |
$873/sf |
42 |
47 |
| Apr 8 |
30 |
$884/sf |
37 |
47 |
| Apr 15 |
32 |
$961/sf |
36 |
43 |
| Apr 22 |
36 |
$964/sf |
31 |
37 |
| Apr 29 |
44 |
$921/sf |
25 |
33 |
| May 6 |
44 |
$921/sf |
30 |
36 |
| May 13 |
46 |
$939/sf |
25 |
34 |
| May 20 |
47 |
$965/sf |
24 |
38 |
| May 27 |
47 |
$965/sf |
30 |
40 |
| Jun 3 |
53 |
$1,006/sf |
32 |
36 |
| Jun 10 |
61 |
$942/sf |
30 |
36 |
| Jun 17 |
62 |
$909/sf |
30 |
37 |
| Jun 24 |
62 |
$909/sf |
28 |
40 |
| Jul 1 |
70 |
$883/sf |
30 |
43 |
| Jul 8 |
67 |
$925/sf |
30 |
47 |
| Jul 15 |
70 |
$888/sf |
31 |
51 |
| Jul 22 |
61 |
$858/sf |
35 |
46 |
| Jul 29 |
57 |
$859/sf |
38 |
50 |
| Aug 5 |
56 |
$892/sf |
37 |
41 |
| Aug 12 |
62 |
$895/sf |
39 |
40 |
| Aug 19 |
67 |
$879/sf |
36 |
36 |
| Aug 26 |
62 |
$899/sf |
39 |
41 |
| Sep 2 |
52 |
$912/sf |
41 |
41 |
| Sep 9 |
53 |
$889/sf |
37 |
37 |
| Sep 16 |
50 |
$877/sf |
39 |
35 |
| Sep 23 |
55 |
$902/sf |
37 |
33 |
| Sep 30 |
61 |
$894/sf |
37 |
32 |
| Oct 7 |
67 |
$899/sf |
37 |
32 |
The $2,000,000 – $3,000,000 Market:
| Date |
NSDCC Active Listings |
Avg. LP/sf |
Avg. DOM |
# of Pendings |
| Jan 2, 2024 |
54 |
$1,046/sf |
65 |
34 |
| Jan 8 |
59 |
$1,034/sf |
57 |
30 |
| Jan 15 |
69 |
$1,094/sf |
44 |
35 |
| Jan 22 |
60 |
$1,108/sf |
42 |
45 |
| Jan 29 |
65 |
$1,126/sf |
41 |
48 |
| Feb 5 |
68 |
$1,120/sf |
31 |
50 |
| Feb 12 |
60 |
$1,123/sf |
34 |
56 |
| Feb 19 |
71 |
$1,130/sf |
29 |
56 |
| Feb 26 |
64 |
$1,138/sf |
30 |
61 |
| Mar 4 |
62 |
$1,202/sf |
33 |
55 |
| Mar 11 |
61 |
$1,211/sf |
29 |
62 |
| Mar 18 |
72 |
$1,143/sf |
32 |
53 |
| Mar 25 |
70 |
$1,101/sf |
31 |
64 |
| Apr 1 |
71 |
$1,049/sf |
31 |
63 |
| Apr 8 |
68 |
$1,076/sf |
31 |
63 |
| Apr 15 |
82 |
$1,058/sf |
33 |
55 |
| Apr 22 |
81 |
$1,066/sf |
38 |
62 |
| Apr 29 |
79 |
$1,076/sf |
34 |
64 |
| May 6 |
77 |
$1,067/sf |
35 |
56 |
| May 13 |
78 |
$1,069/sf |
38 |
58 |
| May 20 |
93 |
$1,049/sf |
39 |
46 |
| May 27 |
92 |
$1,053/sf |
39 |
47 |
| Jun 3 |
105 |
$1,025/sf |
41 |
43 |
| Jun 10 |
105 |
$1,035/sf |
40 |
53 |
| Jun 17 |
107 |
$1,002/sf |
36 |
51 |
| Jun 24 |
118 |
$1,034/sf |
35 |
58 |
| Jul 1 |
111 |
$1,013/sf |
37 |
59 |
| Jul 8 |
111 |
$1,019/sf |
41 |
58 |
| Jul 15 |
120 |
$1,014/sf |
43 |
47 |
| Jul 22 |
124 |
$972/sf |
41 |
47 |
| Jul 29 |
124 |
$974/sf |
41 |
40 |
| Aug 5 |
117 |
$978/sf |
43 |
44 |
| Aug 12 |
114 |
$964/sf |
45 |
42 |
| Aug 19 |
112 |
$982/sf |
45 |
43 |
| Aug 26 |
107 |
$957/sf |
42 |
47 |
| Sep 2 |
102 |
$945/sf |
44 |
49 |
| Sep 9 |
101 |
$965/sf |
45 |
51 |
| Sep 16 |
103 |
$982/sf |
43 |
50 |
| Sep 23 |
99 |
$986/sf |
44 |
58 |
| Sep 30 |
108 |
$984/sf |
44 |
42 |
| Oct 7 |
103 |
$1,006/sf |
44 |
47 |
The $3,000,000 – $4,000,000 Market:
| Date |
NSDCC Active Listings |
Avg. LP/sf |
Avg. DOM |
# of Pendings |
| Jan 2, 2024 |
33 |
$1,216/sf |
92 |
15 |
| Jan 8 |
37 |
$1,248/sf |
83 |
15 |
| Jan 15 |
42 |
$1,236/sf |
77 |
18 |
| Jan 22 |
43 |
$1,283/sf |
77 |
17 |
| Jan 29 |
42 |
$1,242/sf |
75 |
20 |
| Feb 5 |
36 |
$1,363/sf |
73 |
25 |
| Feb 12 |
40 |
$1,252/sf |
34 |
18 |
| Feb 19 |
47 |
$1,515/sf |
45 |
17 |
| Feb 26 |
50 |
$1,512/sf |
42 |
16 |
| Mar 4 |
50 |
$1,588/sf |
44 |
19 |
| Mar 11 |
50 |
$1,594/sf |
44 |
23 |
| Mar 18 |
60 |
$1,537/sf |
38 |
22 |
| Mar 25 |
59 |
$1,614/sf |
70 |
27 |
| Apr 1 |
62 |
$1,660/sf |
76 |
26 |
| Apr 8 |
65 |
$1,479/sf |
76 |
27 |
| Apr 15 |
72 |
$1,442/sf |
70 |
26 |
| Apr 22 |
70 |
$1,462/sf |
75 |
20 |
| Apr 29 |
68 |
$1,434/sf |
75 |
25 |
| May 6 |
67 |
$1,373/sf |
70 |
26 |
| May 13 |
71 |
$1,355/sf |
68 |
25 |
| May 20 |
78 |
$1,298/sf |
63 |
24 |
| May 27 |
79 |
$1,267/sf |
66 |
26 |
| Jun 3 |
75 |
$1,272/sf |
65 |
26 |
| Jun 10 |
81 |
$1,248/sf |
62 |
26 |
| Jun 17 |
89 |
$1,195/sf |
59 |
28 |
| Jun 24 |
84 |
$1,229/sf |
61 |
33 |
| Jul 1 |
87 |
$1,227/sf |
62 |
31 |
| Jul 8 |
77 |
$1,278/sf |
68 |
33 |
| Jul 15 |
91 |
$1,263/sf |
63 |
31 |
| Jul 22 |
82 |
$1,272/sf |
68 |
31 |
| Jul 29 |
84 |
$1,221/sf |
67 |
25 |
| Aug 5 |
80 |
$1,180/sf |
71 |
22 |
| Aug 12 |
80 |
$1,196/sf |
70 |
24 |
| Aug 19 |
80 |
$1,145/sf |
45 |
26 |
| Aug 26 |
80 |
$1,118/sf |
44 |
22 |
| Sep 2 |
81 |
$1,144/sf |
47 |
23 |
| Sep 9 |
84 |
$1,143/sf |
46 |
23 |
| Sep 16 |
84 |
$1,168/sf |
47 |
23 |
| Sep 23 |
88 |
$1,141/sf |
49 |
21 |
| Sep 30 |
83 |
$1,159/sf |
52 |
21 |
| Oct 7 |
89 |
$1,159/sf |
51 |
21 |
The $4,000,000+ Market:
| Date |
NSDCC Active Listings |
Avg. LP/sf |
Avg. DOM |
# of Pendings |
| Jan 2, 2024 |
139 |
$1,858/sf |
116 |
20 |
| Jan 8 |
151 |
$1,896/sf |
109 |
18 |
| Jan 15 |
157 |
$1,879/sf |
106 |
22 |
| Jan 22 |
159 |
$1,824/sf |
104 |
27 |
| Jan 29 |
162 |
$1,758/sf |
108 |
31 |
| Feb 5 |
162 |
$1,718/sf |
108 |
30 |
| Feb 12 |
154 |
$1,705/sf |
107 |
34 |
| Feb 19 |
168 |
$1,685/sf |
107 |
24 |
| Feb 26 |
175 |
$1,691/sf |
105 |
26 |
| Mar 4 |
166 |
$1,692/sf |
97 |
36 |
| Mar 11 |
178 |
$1,663/sf |
90 |
37 |
| Mar 18 |
179 |
$1,691/sf |
90 |
29 |
| Mar 25 |
177 |
$1,693/sf |
83 |
34 |
| Apr 1 |
176 |
$1,713/sf |
87 |
31 |
| Apr 8 |
177 |
$1,771/sf |
82 |
37 |
| Apr 15 |
179 |
$1,731/sf |
88 |
40 |
| Apr 22 |
183 |
$1,733/sf |
85 |
42 |
| Apr 29 |
187 |
$1,765/sf |
81 |
42 |
| May 6 |
191 |
$1,751/sf |
83 |
42 |
| May 13 |
184 |
$1,754/sf |
84 |
47 |
| May 20 |
193 |
$1,734/sf |
81 |
45 |
| May 27 |
202 |
$1,716/sf |
78 |
46 |
| Jun 3 |
203 |
$1,694/sf |
74 |
43 |
| Jun 10 |
206 |
$1,716/sf |
70 |
43 |
| Jun 17 |
204 |
$1,666/sf |
68 |
41 |
| Jun 24 |
208 |
$1,678/sf |
68 |
44 |
| Jul 1 |
213 |
$1,673/sf |
70 |
35 |
| Jul 8 |
212 |
$1,674/sf |
72 |
29 |
| Jul 15 |
217 |
$1,637/sf |
73 |
26 |
| Jul 22 |
218 |
$1,633/sf |
77 |
32 |
| Jul 29 |
221 |
$1,626/sf |
80 |
32 |
| Aug 5 |
222 |
$1,627/sf |
83 |
27 |
| Aug 12 |
217 |
$1,624/sf |
81 |
25 |
| Aug 19 |
209 |
$1,633/sf |
83 |
33 |
| Aug 26 |
209 |
$1,617/sf |
85 |
37 |
| Sep 2 |
207 |
$1,623/sf |
82 |
39 |
| Sep 9 |
204 |
$1,662/sf |
85 |
38 |
| Sep 16 |
201 |
$1,658/sf |
86 |
37 |
| Sep 23 |
200 |
$1,668/sf |
87 |
38 |
| Sep 30 |
192 |
$1,638/sf |
89 |
42 |
| Oct 7 |
189 |
$1,619/sf |
90 |
44 |
NSDCC Weekly New Listings and New Pendings
| Week |
New Listings |
New Pendings |
Total Actives |
Total Pendings |
| Jan 2, 2024 |
18 |
10 |
255 |
113 |
| Jan 8 |
43 |
12 |
278 |
100 |
| Jan 15 |
52 |
20 |
305 |
102 |
| Jan 22 |
50 |
29 |
308 |
122 |
| Jan 29 |
44 |
32 |
314 |
140 |
| Feb 5 |
44 |
33 |
312 |
149 |
| Feb 12 |
37 |
34 |
292 |
159 |
| Feb 19 |
53 |
24 |
326 |
143 |
| Feb 26 |
45 |
37 |
324 |
151 |
| Mar 4 |
52 |
45 |
332 |
166 |
| Mar 11 |
53 |
26 |
331 |
165 |
| Mar 18 |
62 |
32 |
355 |
159 |
| Mar 25 |
45 |
46 |
348 |
186 |
| Apr 1 |
37 |
42 |
340 |
183 |
| Apr 8 |
58 |
36 |
352 |
191 |
| Apr 15 |
58 |
29 |
378 |
184 |
| Apr 22 |
44 |
36 |
384 |
179 |
| Apr 29 |
67 |
36 |
393 |
185 |
| May 6 |
58 |
48 |
394 |
183 |
| May 13 |
47 |
34 |
395 |
186 |
| May 20 |
67 |
26 |
429 |
171 |
| May 27 |
57 |
36 |
435 |
179 |
| Jun 3 |
55 |
26 |
449 |
166 |
| Jun 10 |
77 |
40 |
469 |
175 |
| Jun 17 |
64 |
37 |
474 |
175 |
| Jun 24 |
78 |
29 |
489 |
192 |
| Jul 1 |
51 |
38 |
496 |
188 |
| Jul 8 |
41 |
37 |
479 |
184 |
| Jul 15 |
52 |
29 |
509 |
172 |
| Jul 22 |
43 |
42 |
495 |
172 |
| Jul 29 |
50 |
23 |
503 |
156 |
| Aug 5 |
52 |
40 |
492 |
148 |
| Aug 12 |
49 |
38 |
489 |
150 |
| Aug 19 |
63 |
29 |
486 |
162 |
| Aug 26 |
56 |
38 |
477 |
167 |
| Sep 2 |
56 |
33 |
465 |
167 |
| Sep 9 |
34 |
27 |
463 |
168 |
| Sep 16 |
53 |
33 |
465 |
163 |
| Sep 23 |
54 |
29 |
475 |
166 |
| Sep 30 |
50 |
39 |
470 |
158 |
| Oct 7 |
45 |
30 |
477 |
160 |
NSDCC List Price Quartiles
| Week |
1st Quartile |
Median List Price |
3rd Quartile |
| Jan 2, 2024 |
$2,549,888 |
$4,444,000 |
$8,350,000 |
| Jan 8 |
$2,572,444 |
$4,447,000 |
$8,097,500 |
| Jan 15 |
$2,499,000 |
$4,200,000 |
$7,950,000 |
| Jan 22 |
$2,429,000 |
$4,250,000 |
$7,450,000 |
| Jan 29 |
$2,399,000 |
$4,225,000 |
$7,495,000 |
| Feb 5 |
$2,398,000 |
$4,272,500 |
$7,495,000 |
| Feb 12 |
$2,499,800 |
$4,297,500 |
$7,495,000 |
| Feb 19 |
$2,499,400 |
$4,200,000 |
$6,972,500 |
| Feb 26 |
$2,649,400 |
$4,350,000 |
$7,300,000 |
| Mar 4 |
$2,525,000 |
$4,225,000 |
$7,149,500 |
| Mar 11 |
$2,649,000 |
$4,295,000 |
$7,495,000 |
| Mar 18 |
$2,500,000 |
$4,000,000 |
$6,750,000 |
| Mar 25 |
$2,680,000 |
$4,097,499 |
$6,750,000 |
| Apr 1 |
$2,785,000 |
$4,150,000 |
$6,999,999 |
| Apr 8 |
$2,680,000 |
$4,047,500 |
$6,999,000 |
| Apr 15 |
$2,570,000 |
$3,899,500 |
$6,797,500 |
| Apr 22 |
$2,499,000 |
$3,982,500 |
$6,495,000 |
| Apr 29 |
$2,399,000 |
$3,990,000 |
$6,750,000 |
| May 6 |
$2,485,000 |
$3,995,000 |
$6,825,000 |
| May 13 |
$2,475,000 |
$3,895,000 |
$6,900,000 |
| May 20 |
$2,420,000 |
$3,750,000 |
$6,480,000 |
| May 27 |
$2,495,000 |
$3,840,000 |
$6,695,000 |
| Jun 3 |
$2,475,000 |
$3,749,000 |
$6,395,000 |
| Jun 10 |
$2,388,000 |
$3,500,000 |
$6,187,000 |
| Jun 17 |
$2,412,500 |
$3,599,500 |
$5,995,000 |
| Jun 24 |
$2,350,000 |
$3,500,000 |
$6,398,000 |
| Jul 1 |
$2,398,000 |
$3,600,000 |
$6,400,000 |
| Jul 8 |
$2,399,000 |
$3,650,000 |
$6,500,000 |
| Jul 15 |
$2,399,999 |
$3,500,000 |
$6,398,000 |
| Jul 22 |
$2,399,000 |
$3,695,000 |
$6,398,000 |
| Jul 29 |
$2,375,000 |
$3,650,000 |
$6,187,000 |
| Aug 5 |
$2,350,000 |
$3,699,500 |
$6,295,000 |
| Aug 12 |
$2,349,000 |
$3,650,000 |
$5,995,000 |
| Aug 19 |
$2,315,000 |
$3,595,000 |
$5,995,000 |
| Aug 26 |
$2,299,999 |
$3,649,000 |
$5,999,000 |
| Sep 2 |
$2,350,000 |
$3,698,000 |
$6,495,000 |
| Sep 9 |
$2,300,000 |
$3,700,000 |
$6,495,000 |
| Sep 16 |
$2,345,000 |
$3,695,000 |
$6,250,000 |
| Sep 23 |
$2,299,000 |
$3,600,000 |
$6,475,000 |
| Sep 30 |
$2,297,000 |
$3,495,000 |
$6,099,000 |
| Oct 7 |
$2,200,000 |
$3,490,000 |
$5,900,000 |


For those potential buyers who want to feel good and who like waiting:
When Ashwin and Poonam Jain began searching for a larger home for themselves and two children in San Ramon earlier this summer, they quickly realized they were spending hours scrutinizing homes online, evaluating school districts and comparing sales prices of nearby listings.
Though they’d both appreciated agents’ help in the past, they felt as experienced homebuyers that they didn’t need the same hand-holding this time. So why would they pay an agent tens of thousands of dollars to come in at the end and write up an offer?
“As a buyer, we are doing all the work,” Ashwin said. “Sometimes we struggled to see: Where is the value added from a broker?”
For years, homebuyers could largely ignore what their agents charged because their fee — traditionally around 2.5% — was covered by the seller. Nationally, real estate commissions are an estimated $100 billion business. For a median-priced Bay Area home selling at $1.27 million, a fee of 2.5% would amount to $31,750.
But earlier this year, the National Association of Realtors, responding to a lawsuit, changed its guidelines for commissions to settle claims from dozens of home sellers who said the rules cornered them into paying both their agent and the buyer’s.
Now, buyers can’t count on sellers to pay their agents’ fees, too. Since the real estate group’s new rules debuted in August, buyers have had to sign agreements with their agents promising to pay a certain commission if the seller doesn’t offer one. Many sellers are sticking with tradition and still offering buyers’ agents a 2.5% commission — but faced with the possibility of paying themselves, homebuyers like the Jains are questioning whether an agent is worth it.
The Jains started to look into alternatives. One Oakland company, TurboHome, promised to use artificial intelligence tools to help them review disclosures on a home and compare nearby property sales. When the time came to make an offer, a TurboHome agent, a real human being, would be there to help with negotiations and closing.
The fee? If the seller offered a commission to a buyer’s agent, TurboHome would take $10,000. Anything beyond that, the Jains would keep. If the seller didn’t offer commission, the Jains would pay the fee out of pocket.
After connecting with TurboHome’s agent, the Jains put in an offer on a five-bedroom, four-bath house in San Ramon listed at $2.75 million. Based on what recent homes had sold for, they bid under asking, at $2.65 million. A traditional agent would have taken $68,750 as a fee, but with TurboHome, the Jains would get a $58,750 credit back — money they could use to up the offer if the sellers countered or put toward a down payment if they won.
Ultimately, though, the home got two offers over $3 million. The sellers asked if the Jains wanted to increase their offer, but it was more than they were willing to pay.
Even though they lost the home, the Jains feel good about the experience — Ashwin and Poonam aren’t in a rush, and they knew how much they were willing to spend. TurboHome never put pressure on them to offer more, Ashwin said.
“Agents always have reasons to put in an offer over asking … to inflate a number and encourage a would-be buyer,” Jain said. “But it’s also in their interest to see the transaction go through.”
Don’t people see through the nonsense?
A buyers agent giving buyers $$$ back after close is equivalent to a lower offer or just a lower commission for the buyers agent.
Logically I realize that numbers make sense. Unfortunately buying and selling real estate isn’t logical and agents (generally) aren’t ethical. Everyone says that they are but when cash hits the table things change.
In Real Estate experience is what makes money. It’s what allows deals to close. It’s what keeps the ethically challenged from going down the wrong path. This is what’s worth paying for. Does it matter that you get 50k back after close but overpaid by 300k when compared to using a regular buyers agent?
Also, trusting AI to find you a house is silly. Maybe in 20 years it will make sense but people will always find a way to manipulate the system in their favor. AI will always be catching up.
Maybe in 20 years it will make sense
Yes everyone will be brain-washed by then and just letting AI have its way with us.