There are 501 active listings today between La Jolla and Carlsbad.
The number of homes for sale in every price category are at their highest levels of the year, with the Under-$2,000,000 category rising from 59 to 74 actives (+20%) in the last week.
The high point in 2022 was 480 actives, and we hit 430 actives in 2023 (both in July). Last year, there were two weeks in July that had 500+ actives.
This year, it appears we will have several months of 500+. Through August?
It’s a buying opportunity for those who have the guts and are willing to dig out an acceptable deal.
It will take more work than usual – additional frog-kissing will be involved!
The $0 – $2,000,000 Market:
| Date |
NSDCC Active Listings |
Avg. LP/sf |
Avg. DOM |
# of Pendings |
| Jan 6, 2025 |
43 |
$918/sf |
63 |
27 |
| Jan 13 |
45 |
$936/sf |
53 |
22 |
| Jan 20 |
47 |
$908/sf |
54 |
25 |
| Jan 27 |
48 |
$904/sf |
48 |
32 |
| Feb 3 |
51 |
$914/sf |
47 |
41 |
| Feb 10 |
45 |
$935/sf |
46 |
45 |
| Feb 17 |
45 |
$916/sf |
46 |
46 |
| Feb 24 |
45 |
$958/sf |
48 |
40 |
| Mar 3 |
50 |
$950/sf |
37 |
42 |
| Mar 10 |
55 |
$908/sf |
36 |
45 |
| Mar 17 |
53 |
$891/sf |
35 |
50 |
| Mar 24 |
53 |
$898/sf |
30 |
51 |
| Mar 31 |
58 |
$878/sf |
35 |
44 |
| Apr 7 |
56 |
$867/sf |
30 |
43 |
| Apr 14 |
63 |
$906/sf |
32 |
40 |
| Apr 21 |
59 |
$936/sf |
35 |
37 |
| Apr 28 |
74 |
$899/sf |
32 |
39 |
The $2,000,000 – $3,000,000 Market:
| Date |
NSDCC Active Listings |
Avg. LP/sf |
Avg. DOM |
# of Pendings |
| Jan 6, 2025 |
55 |
$1,029/sf |
66 |
36 |
| Jan 13 |
58 |
$990/sf |
63 |
31 |
| Jan 20 |
64 |
$1,018/sf |
57 |
26 |
| Jan 27 |
64 |
$1,025/sf |
53 |
31 |
| Feb 3 |
71 |
$1,009/sf |
50 |
31 |
| Feb 10 |
75 |
$1,005/sf |
46 |
36 |
| Feb 17 |
81 |
$1,015/sf |
44 |
39 |
| Feb 24 |
80 |
$1,012/sf |
38 |
52 |
| Mar 3 |
80 |
$1,034/sf |
33 |
49 |
| Mar 10 |
92 |
$1,029/sf |
37 |
44 |
| Mar 17 |
98 |
$1,015/sf |
39 |
44 |
| Mar 24 |
98 |
$1,008/sf |
41 |
52 |
| Mar 31 |
100 |
$997/sf |
44 |
54 |
| Apr 7 |
94 |
$940/sf |
43 |
54 |
| Apr 14 |
96 |
$962/sf |
42 |
53 |
| Apr 21 |
107 |
$1,000/sf |
43 |
53 |
| Apr 28 |
109 |
$1,010/sf |
44 |
49 |
The $3,000,000 – $4,000,000 Market:
| Date |
NSDCC Active Listings |
Avg. LP/sf |
Avg. DOM |
# of Pendings |
| Jan 6, 2025 |
44 |
$1,091/sf |
82 |
19 |
| Jan 13 |
46 |
$1,122/sf |
77 |
19 |
| Jan 20 |
52 |
$1,156/sf |
70 |
16 |
| Jan 27 |
49 |
$1,197/sf |
67 |
20 |
| Feb 3 |
56 |
$1,182/sf |
55 |
21 |
| Feb 10 |
58 |
$1,158/sf |
51 |
25 |
| Feb 17 |
58 |
$1,179/sf |
54 |
24 |
| Feb 24 |
56 |
$1,168/sf |
52 |
24 |
| Mar 3 |
51 |
$1,147/sf |
56 |
31 |
| Mar 10 |
56 |
$1,240/sf |
61 |
34 |
| Mar 17 |
60 |
$1,209/sf |
61 |
36 |
| Mar 24 |
60 |
$1,209/sf |
62 |
39 |
| Mar 31 |
62 |
$1,158/sf |
64 |
34 |
| Apr 7 |
68 |
$1,208/sf |
59 |
34 |
| Apr 14 |
79 |
$1,193/sf |
55 |
26 |
| Apr 21 |
85 |
$1,230/sf |
54 |
28 |
| Apr 28 |
85 |
$1,198/sf |
53 |
28 |
The $4,000,000+ Market:
| Date |
NSDCC Active Listings |
Avg. LP/sf |
Avg. DOM |
# of Pendings |
| Jan 6, 2025 |
160 |
$1,822/sf |
105 |
27 |
| Jan 13 |
156 |
$1,868/sf |
105 |
31 |
| Jan 20 |
170 |
$1,936/sf |
95 |
29 |
| Jan 27 |
180 |
$1,877/sf |
90 |
31 |
| Feb 3 |
189 |
$1,884/sf |
85 |
31 |
| Feb 10 |
189 |
$1,864/sf |
88 |
29 |
| Feb 17 |
192 |
$1,875/sf |
90 |
32 |
| Feb 24 |
195 |
$1,869/sf |
91 |
34 |
| Mar 3 |
200 |
$1,860/sf |
87 |
34 |
| Mar 10 |
213 |
$1,811/sf |
83 |
36 |
| Mar 17 |
208 |
$1,755/sf |
85 |
30 |
| Mar 24 |
211 |
$1,800/sf |
86 |
25 |
| Mar 31 |
213 |
$1,784/sf |
90 |
32 |
| Apr 7 |
219 |
$1,777/sf |
90 |
33 |
| Apr 14 |
230 |
$1,790/sf |
87 |
35 |
| Apr 21 |
231 |
$1,792/sf |
87 |
32 |
| Apr 28 |
235 |
$1,772/sf |
88 |
28 |
NSDCC Weekly New Listings and New Pendings
| Week |
New Listings |
New Pendings |
Total Actives |
Total Pendings |
| Jan 6 |
27 |
11 |
298 |
108 |
| Jan 13 |
38 |
26 |
301 |
101 |
| Jan 20 |
55 |
16 |
328 |
95 |
| Jan 27 |
60 |
32 |
337 |
113 |
| Feb 3 |
72 |
28 |
363 |
123 |
| Feb 10 |
50 |
34 |
364 |
135 |
| Feb 17 |
50 |
29 |
373 |
140 |
| Feb 24 |
58 |
38 |
374 |
148 |
| Mar 3 |
60 |
31 |
378 |
152 |
| Mar 10 |
60 |
30 |
411 |
156 |
| Mar 17 |
49 |
37 |
413 |
157 |
| Mar 24 |
57 |
39 |
414 |
164 |
| Mar 31 |
47 |
27 |
425 |
162 |
| Apr 7 |
52 |
31 |
431 |
162 |
| Apr 14 |
70 |
28 |
462 |
153 |
| Apr 21 |
58 |
24 |
478 |
148 |
| Apr 28 |
71 |
30 |
501 |
143 |
NSDCC List Price Quartiles
| Week |
1st Quartile |
Median List Price |
3rd Quartile |
| Jan 6 |
$2,685,000 |
$4,472,500 |
$7,995,000 |
| Jan 13 |
$2,499,000 |
$4,250,000 |
$7,750,000 |
| Jan 20 |
$2,695,000 |
$4,300,000 |
$7,767,000 |
| Jan 27 |
$2,795,000 |
$4,498,000 |
$7,995,000 |
| Feb 3 |
$2,695,000 |
$4,350,000 |
$7,499,000 |
| Feb 10 |
$2,799,000 |
$4,299,000 |
$7,695,000 |
| Feb 17 |
$2,695,000 |
$4,200,000 |
$7,750,000 |
| Feb 24 |
$2,699,500 |
$4,250,000 |
$7,645,000 |
| Mar 3 |
$2,550,000 |
$4,375,000 |
$7,497,000 |
| Mar 10 |
$2,500,000 |
$4,200,000 |
$7,250,000 |
| Mar 17 |
$2,500,000 |
$4,000,000 |
$6,995,000 |
| Mar 24 |
$2,595,000 |
$4,047,500 |
$7,275,000 |
| Mar 31 |
$2,499,000 |
$4,000,000 |
$7,300,000 |
| Apr 7 |
$2,500,000 |
$4,000,000 |
$6,995,000 |
| Apr 14 |
$2,500,000 |
$3,999,000 |
$6,995,000 |
| Apr 21 |
$2,590,000 |
$3,995,000 |
$6,799,500 |
| Apr 28 |
$2,490,000 |
$3,988,000 |
$6,500,000 |


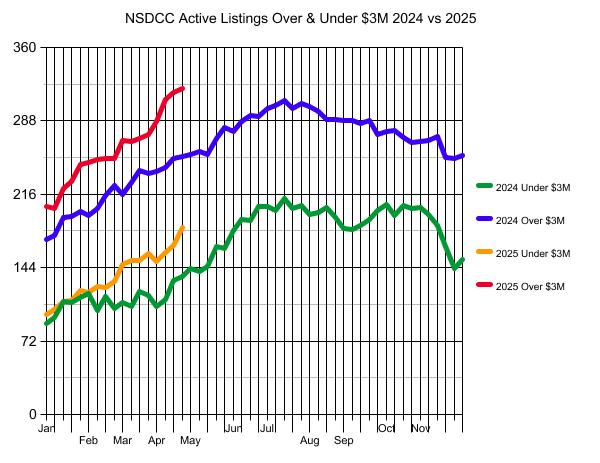
My husband wants to know -why don’t the end of 2024 and beginning of 2025 lines match? Why doesn’t the red line start where the purple line ends, and why doesn’t the orange line start where the green line ends? Thank you!
I wondered the same thing in the past, and I think it’s because Jim takes a well-deserved break from running the numbers in the second half of December. If you look at the weekly tables he posts, I think there is no reporting in 2024 after 12/9/24, and none in 2023 after 12/4/23. But that doesn’t take away from the big picture or affect the later trends. Thanks for the amazing blog and data Jim!
Yes the graph only has 50 slots available, so the last two weeks of December aren’t included.
There aren’t many during that time that are listing or selling so we aren’t missing much.
Side note: if you want to see something fascinating about the inventory, check the new listings at 1:00am on Jan 1st.
Realtors scramble to input listings just after midnight to be the first listing of the year. Listings are numbered so they must take pride in being the first?
Thanks for the amazing blog and data Jim!
Thanks Anon!