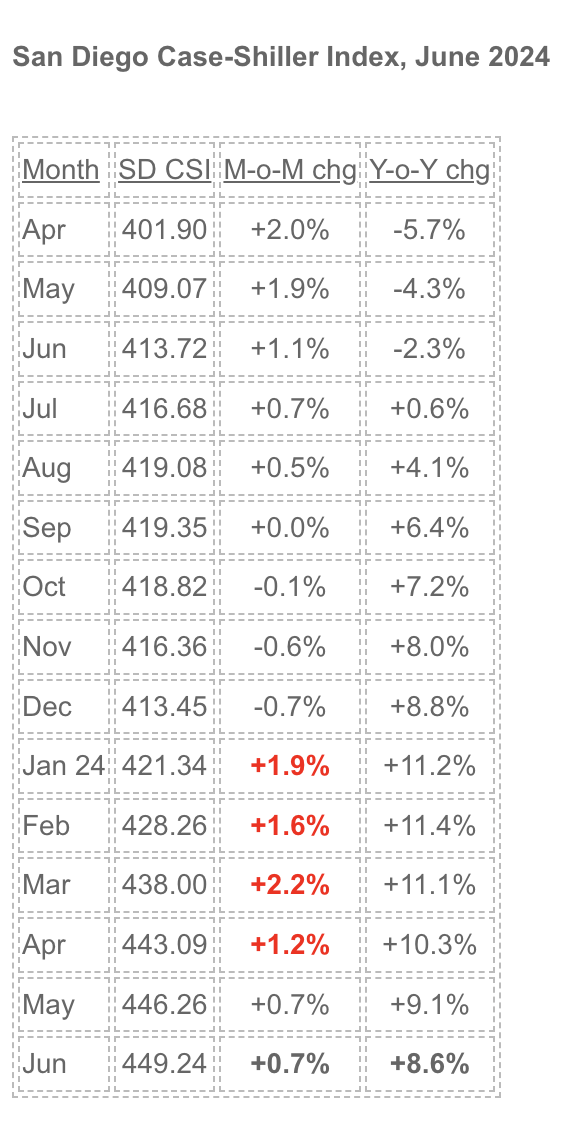
I think we will experience a very similar trend in 2025.
A hot market and prices for the first four months, and mellow-down-easy for the rest of the year.
And April was already slowing. The first quarter of 2025 will be prime selling season!
Plan accordingly!
~~~~~~~~~~~~~~~~~~~~~~~~~~~~~~
“While both housing and inflation have slowed, the gap between the two is larger than historical norms, with our National Index averaging 2.8% more than the Consumer Price Index,” noted Brian Luke, head of commodities, real and digital assets at S&P Dow Jones Indices, in a release. “That is a full percentage point above the 50-year average. Before accounting for inflation, home prices have risen over 1,100% since 1974, but have slightly more than doubled (111%) after accounting for inflation.”
New York saw the highest annual gain among the 20 cities, with prices climbing 9% in June, followed by San Diego and Las Vegas with annual increases of 8.7% and 8.5%, respectively. Portland, Oregon, saw just a 0.8% annual rise in June, the smallest gain of the top cities.
Since housing affordability has been a major talking point in this election cycle, this month’s report also broke out home values by price tier, dividing each city’s market into three tiers. Looking just at large markets over the past five years, it found that 75% of the markets covered show low-price tiers rising faster than the overall market.
“For example, the lower tier of the Atlanta market has risen 18% faster than the middle- and higher-tiered homes,” Luke wrote in the release.
“New York’s low tier has the largest five-year outperformance, rising nearly 20% above the overall New York region,” he continued. “New York also has the largest divergence between low- and high-tier prices. Conversely, San Diego has seen the largest appreciation in higher-tier homes over the past five years.”
Prices in the overall San Diego market are up 72% in the past five years, but the high tier is up 79% versus 63% for the lower tier.


0 Comments