

During the frenzy, the market had waves of new pendings happen in the same week or two, as if there is a home-buying karma that sweeps a bunch of buyers into action at the same time. It’s probably more due to them digesting the new listings, and after a couple of weeks of 2024, it appears buyers are acting!
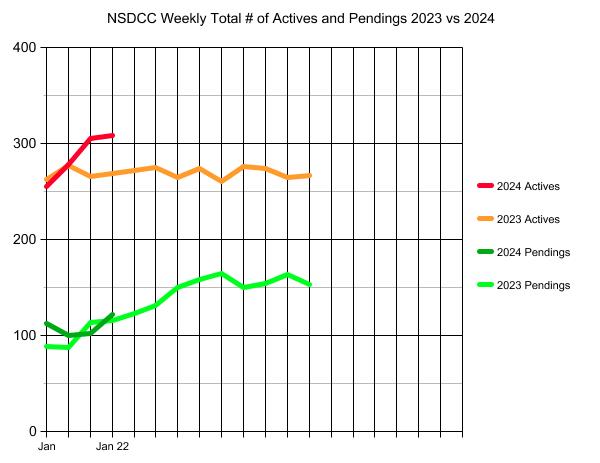
The NSDCC pendings count rose from 102 to 122 this week, a 20% pop!
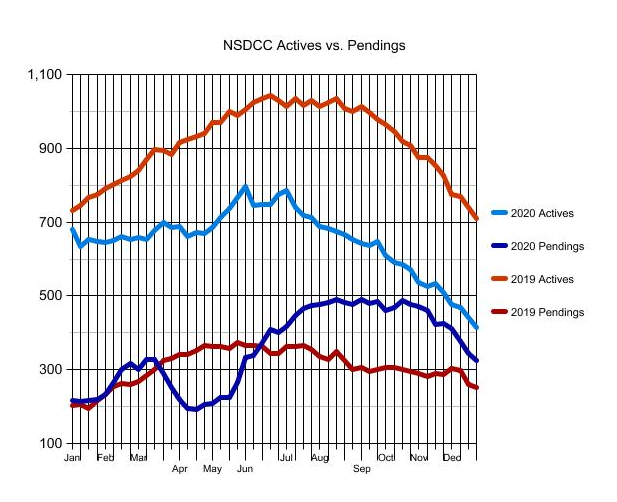
In the graph above, you can see that last year the market was cooking by mid-February. When the actives and pending are stable, it means that the deals are closing as fast as the new listings are coming on!
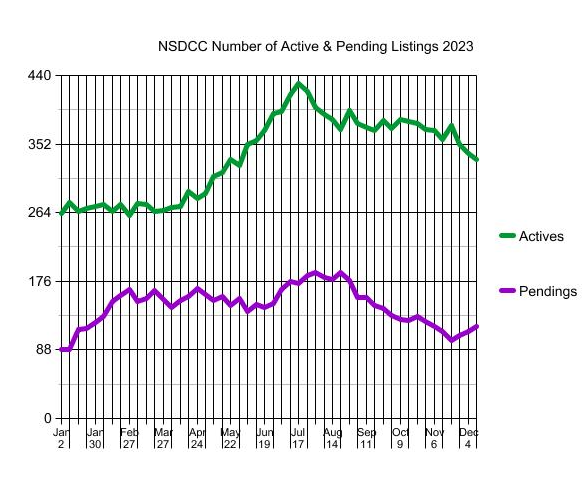
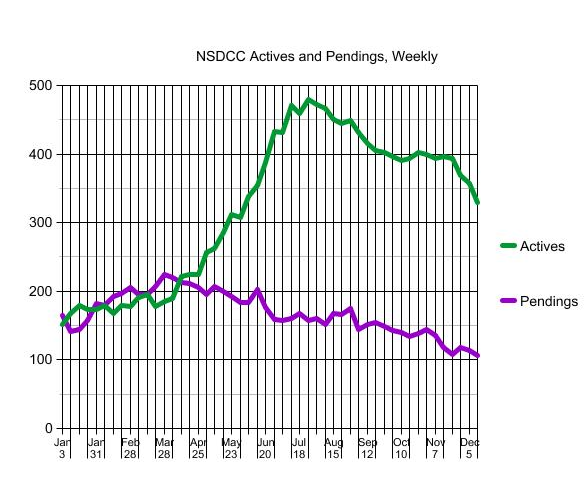
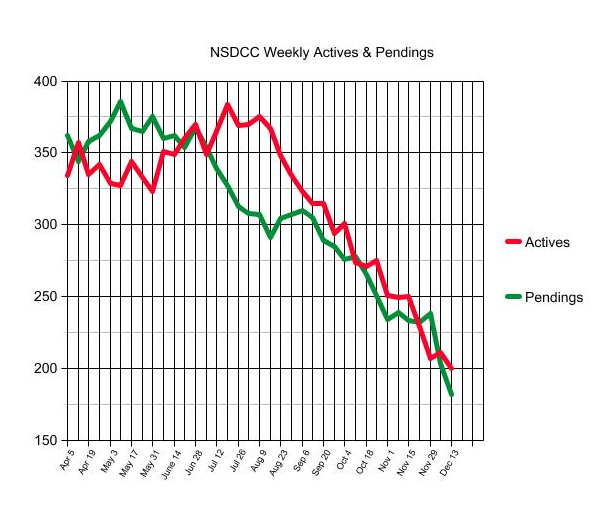
Here is the history from the last few years:
2023:
2022:
2021:
2019/2020:
The $0 – $1,500,000 Market:
| Date | ||||
| Jan 2, 2024 | ||||
| Jan 8 | ||||
| Jan 15 | ||||
| Jan 22 |
The $1,500,000 – $2,000,000 Market:
| Date | ||||
| Jan 2, 2024 | ||||
| Jan 8 | ||||
| Jan 15 | ||||
| Jan 22 |
The $2,000,000 – $3,000,000 Market:
| Date | ||||
| Jan 2, 2024 | ||||
| Jan 8 | ||||
| Jan 15 | ||||
| Jan 22 |
The $3,000,000 – $4,000,000 Market:
| Date | ||||
| Jan 2, 2024 | ||||
| Jan 8 | ||||
| Jan 15 | ||||
| Jan 22 |
The $4,000,000+ Market:
| Date | ||||
| Jan 2, 2024 | ||||
| Jan 8 | ||||
| Jan 15 | ||||
| Jan 22 |
NSDCC Weekly New Listings and New Pendings
| Week | ||||
| Jan 2, 2024 | ||||
| Jan 8 | ||||
| Jan 15 | ||||
| Jan 22 |
NSDCC List Price Quartiles
| Week | |||
| Jan 2, 2024 | |||
| Jan 8 | |||
| Jan 15 | |||
| Jan 22 |


0 Comments