

NSDCC Listings, January 1-15
2023: 100
2024: 99
You could say that the 2024 inventory is tracking very closely to last year’s numbers! There will be extras added to this year’s count, so comparatively, we can guess that the 2024 count will be 110-115 or so.
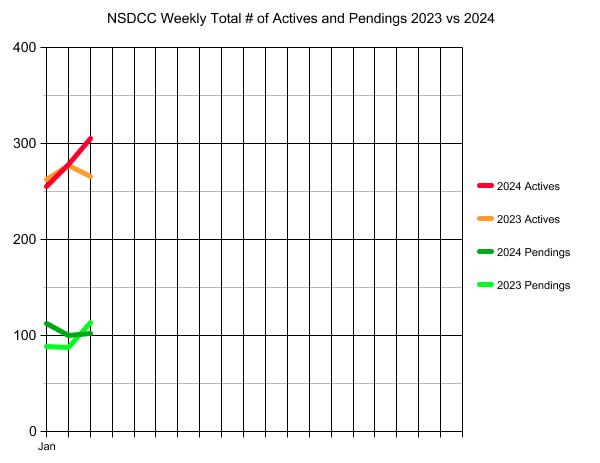
But look at the difference in the graph above.
Last year got off to a fast start as the number of pendings picked up right away….but not this year. The actives are there, but they aren’t flying into escrow like last year.
Our open house had a similar result. lots of attendees, glowing remarks, hints of offers, but we’re not in escrow yet. I only saw a handful of other open houses, but the results looked the same – lots of people milling about, but that’s about it.
A slower start probably means that the inventory is still very thin, which makes it hard to compare. Mortgage rates are about the same as they were last January, so that’s not it – but the rate expectation is way different, with Fed moves expected over the next few months. It could cause buyers to be very deliberate in the early going.
Hopefully, the pendings count will increase over the next few days as the fruits from the weekend are logged. But the actives are surging ahead for now.
The $0 – $1,500,000 Market:
| Date | ||||
| Jan 2, 2024 | ||||
| Jan 8 | ||||
| Jan 15 |
The $1,500,000 – $2,000,000 Market:
| Date | ||||
| Jan 2, 2024 | ||||
| Jan 8 | ||||
| Jan 15 |
The $2,000,000 – $3,000,000 Market:
| Date | ||||
| Jan 2, 2024 | ||||
| Jan 8 | ||||
| Jan 15 |
The $3,000,000 – $4,000,000 Market:
| Date | ||||
| Jan 2, 2024 | ||||
| Jan 8 | ||||
| Jan 15 |
The $4,000,000+ Market:
| Date | ||||
| Jan 2, 2024 | ||||
| Jan 8 | ||||
| Jan 15 |
NSDCC Weekly New Listings and New Pendings
| Week | ||||
| Jan 2, 2024 | ||||
| Jan 8 | ||||
| Jan 15 |
NSDCC List Price Quartiles
| Week | |||
| Jan 2, 2024 | |||
| Jan 8 | |||
| Jan 15 |


0 Comments