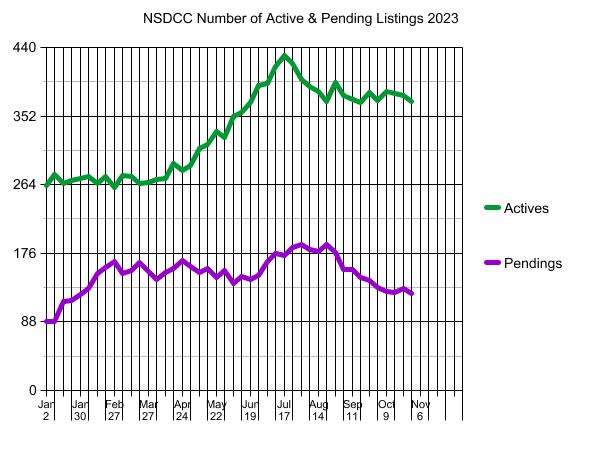
How does the current inventory of homes for sale compare to previous counts?
NSDCC Active Inventory, Last Week of October:
2016: 962
2017: 805
2018: 1,000
2019: 909
2020: 590
2021: 277
2022: 399
2023: 371
They say you can’t predict the future, but let’s give it a go.
The NSDCC inventory at the end of next October will be between 300-1,000. Based on higher rates and recent history, there will probably be around 400 houses for sale again.
The rates aren’t going to change. The ultra-low inventory isn’t going to change, especially if potential home sellers hear that the market is “bad” for selling. There will be occasional deals, just like this year but you’ll have to dig them out – they won’t be lying around.
Next year is going to look a lot like this year.
The $0 – $1,500,000 Market:
| Date |
NSDCC Active Listings |
Avg. LP/sf |
Avg. DOM |
# of Pendings |
| Jan 2, 2023 |
22 |
$719/sf |
75 |
15 |
| Jan 9 |
26 |
$687/sf |
50 |
14 |
| Jan 16 |
23 |
$701/sf |
52 |
20 |
| Jan 23 |
25 |
$751/sf |
60 |
21 |
| Jan 30 |
23 |
$788/sf |
45 |
25 |
| Feb 6 |
18 |
$750/sf |
59 |
24 |
| Feb 13 |
18 |
$770/sf |
48 |
26 |
| Feb 20 |
17 |
$778/sf |
49 |
26 |
| Feb 27 |
18 |
$802/sf |
48 |
23 |
| Mar 6 |
22 |
$802/sf |
44 |
14 |
| Mar 13 |
22 |
$747/sf |
45 |
16 |
| Mar 20 |
16 |
$826/sf |
49 |
21 |
| Mar 27 |
17 |
$853/sf |
47 |
20 |
| Apr 3 |
19 |
$803/sf |
37 |
20 |
| Apr 10 |
11 |
$778/sf |
53 |
30 |
| Apr 17 |
15 |
$690/sf |
44 |
27 |
| Apr 24 |
12 |
$682/sf |
33 |
25 |
| May 1 |
11 |
$795/sf |
35 |
27 |
| May 8 |
14 |
$780/sf |
33 |
24 |
| May 15 |
16 |
$770/sf |
37 |
22 |
| May 22 |
21 |
$747/sf |
45 |
18 |
| May 29 |
20 |
$757/sf |
52 |
21 |
| Jun 5 |
23 |
$755/sf |
49 |
20 |
| Jun 12 |
17 |
$711/sf |
31 |
32 |
| Jun 19 |
16 |
$674/sf |
34 |
33 |
| Jun 26 |
20 |
$677/sf |
32 |
29 |
| Jul 3 |
21 |
$645/sf |
28 |
33 |
| Jul 10 |
23 |
$692/sf |
30 |
32 |
| Jul 17 |
21 |
$730/sf |
37 |
30 |
| Jul 24 |
21 |
$704/sf |
37 |
32 |
| Jul 31 |
21 |
$713/sf |
44 |
27 |
| Aug 7 |
22 |
$692/sf |
50 |
25 |
| Aug 14 |
24 |
$693/sf |
48 |
24 |
| Aug 21 |
22 |
$688/sf |
25 |
29 |
| Aug 28 |
25 |
$679/sf |
47 |
38 |
| Sep 4 |
23 |
$718/sf |
50 |
36 |
| Sep 11 |
29 |
$685/sf |
44 |
33 |
| Sep 18 |
28 |
$696/sf |
35 |
28 |
| Sep 25 |
31 |
$725/sf |
36 |
25 |
| Oct 2 |
24 |
$711/sf |
50 |
25 |
| Oct 9 |
29 |
$742/sf |
47 |
20 |
| Oct 16 |
35 |
$762/sf |
45 |
14 |
| Oct 23 |
31 |
$745/sf |
43 |
18 |
| Oct 30 |
28 |
$777/sf |
40 |
16 |
The $1,500,000 – $2,000,000 Market:
| Date |
NSDCC Active Listings |
Avg. LP/sf |
Avg. DOM |
# of Pendings |
| Jan 2, 2023 |
45 |
$809/sf |
60 |
18 |
| Jan 9 |
55 |
$828/sf |
53 |
19 |
| Jan 16 |
46 |
$838/sf |
53 |
30 |
| Jan 23 |
43 |
$793/sf |
52 |
31 |
| Jan 30 |
40 |
$778/sf |
54 |
34 |
| Feb 6 |
42 |
$814/sf |
46 |
30 |
| Feb 13 |
35 |
$823/sf |
51 |
39 |
| Feb 20 |
34 |
$801/sf |
47 |
40 |
| Feb 27 |
27 |
$846/sf |
33 |
45 |
| Mar 6 |
29 |
$893/sf |
33 |
41 |
| Mar 13 |
32 |
$850/sf |
33 |
39 |
| Mar 20 |
27 |
$872/sf |
36 |
41 |
| Mar 27 |
22 |
$832/sf |
39 |
36 |
| Apr 3 |
21 |
$779/sf |
27 |
36 |
| Apr 10 |
22 |
$816/sf |
26 |
33 |
| Apr 17 |
27 |
$797/sf |
21 |
33 |
| Apr 24 |
28 |
$856/sf |
31 |
34 |
| Apr 24 |
28 |
$856/sf |
31 |
34 |
| May 1 |
30 |
$789/sf |
28 |
36 |
| May 8 |
36 |
$808/sf |
25 |
37 |
| May 15 |
33 |
$776/sf |
33 |
44 |
| May 22 |
35 |
$818/sf |
36 |
44 |
| May 29 |
38 |
$786/sf |
33 |
40 |
| Jun 5 |
39 |
$791/sf |
34 |
30 |
| Jun 12 |
37 |
$754/sf |
37 |
32 |
| Jun 19 |
36 |
$779/sf |
35 |
35 |
| Jun 26 |
39 |
$766/sf |
34 |
36 |
| Jul 3 |
39 |
$776/sf |
41 |
40 |
| Jul 10 |
45 |
$780/sf |
37 |
39 |
| Jul 17 |
53 |
$807/sf |
29 |
36 |
| Jul 24 |
51 |
$787/sf |
32 |
38 |
| Jul 31 |
51 |
$763/sf |
30 |
39 |
| Aug 7 |
45 |
$750/sf |
36 |
39 |
| Aug 14 |
42 |
$739/sf |
38 |
39 |
| Aug 21 |
39 |
$707/sf |
29 |
46 |
| Aug 28 |
51 |
$723/sf |
30 |
39 |
| Sep 4 |
46 |
$739/sf |
31 |
30 |
| Sep 11 |
42 |
$771/sf |
27 |
30 |
| Sep 18 |
40 |
$805/sf |
27 |
31 |
| Sep 25 |
38 |
$851/sf |
28 |
33 |
| Oct 2 |
45 |
$827/sf |
28 |
27 |
| Oct 9 |
43 |
$891/sf |
32 |
27 |
| Oct 16 |
48 |
$848/sf |
32 |
30 |
| Oct 23 |
48 |
$837/sf |
34 |
26 |
| Oct 30 |
49 |
$829/sf |
34 |
30 |
The $2,000,000 – $3,000,000 Market:
| Date |
NSDCC Active Listings |
Avg. LP/sf |
Avg. DOM |
# of Pendings |
| Jan 2, 2023 |
52 |
$869/sf |
69 |
30 |
| Jan 9 |
57 |
$940/sf |
66 |
31 |
| Jan 16 |
50 |
$948/sf |
61 |
36 |
| Jan 23 |
51 |
$949/sf |
58 |
35 |
| Jan 30 |
54 |
$964/sf |
55 |
34 |
| Feb 6 |
60 |
$930/sf |
51 |
42 |
| Feb 13 |
51 |
$1,038/sf |
52 |
47 |
| Feb 20 |
58 |
$1,022/sf |
47 |
46 |
| Feb 27 |
56 |
$1,064/sf |
52 |
49 |
| Mar 6 |
57 |
$995/sf |
50 |
50 |
| Mar 13 |
55 |
$1,015/sf |
53 |
47 |
| Mar 20 |
50 |
$1,011/sf |
58 |
50 |
| Mar 27 |
54 |
$1,039/sf |
49 |
47 |
| Apr 3 |
54 |
$1,035/sf |
52 |
38 |
| Apr 10 |
55 |
$1,004/sf |
48 |
42 |
| Apr 17 |
64 |
$985/sf |
47 |
46 |
| Apr 24 |
57 |
$1,001/sf |
43 |
50 |
| May 1 |
57 |
$1,008/sf |
42 |
45 |
| May 8 |
68 |
$1,031/sf |
36 |
41 |
| May 15 |
71 |
$1,007/sf |
34 |
39 |
| May 22 |
77 |
$1,003/sf |
34 |
38 |
| May 29 |
74 |
$1,002/sf |
39 |
43 |
| Jun 5 |
77 |
$991/sf |
42 |
44 |
| Jun 12 |
82 |
$986/sf |
48 |
45 |
| Jun 19 |
90 |
$978/sf |
48 |
33 |
| Jun 26 |
90 |
$1,015/sf |
49 |
33 |
| Jul 3 |
92 |
$1,019/sf |
49 |
36 |
| Jul 10 |
89 |
$1,021/sf |
50 |
44 |
| Jul 17 |
97 |
$1,013/sf |
48 |
42 |
| Jul 24 |
91 |
$1,010/sf |
48 |
42 |
| Jul 31 |
81 |
$999/sf |
56 |
52 |
| Aug 7 |
81 |
$1,011/sf |
53 |
49 |
| Aug 14 |
76 |
$996/sf |
58 |
48 |
| Aug 21 |
71 |
$959/sf |
45 |
49 |
| Aug 28 |
82 |
$990/sf |
46 |
43 |
| Sep 4 |
81 |
$1,022/sf |
46 |
39 |
| Sep 11 |
84 |
$1,017/sf |
44 |
39 |
| Sep 18 |
82 |
$1,031/sf |
43 |
44 |
| Sep 25 |
87 |
$1,079/sf |
44 |
41 |
| Oct 2 |
83 |
$1,081/sf |
43 |
44 |
| Oct 9 |
83 |
$1,056/sf |
46 |
42 |
| Oct 16 |
76 |
$1,059/sf |
48 |
42 |
| Oct 23 |
78 |
$1,068/sf |
46 |
47 |
| Oct 30 |
72 |
$1,068/sf |
53 |
38 |
The $3,000,000 – $4,000,000 Market:
| Date |
NSDCC Active Listings |
Avg. LP/sf |
Avg. DOM |
# of Pendings |
| Jan 2, 2023 |
29 |
$1,236/sf |
85 |
6 |
| Jan 9 |
29 |
$1,180/sf |
80 |
5 |
| Jan 16 |
31 |
$1,196/sf |
73 |
8 |
| Jan 23 |
33 |
$1,201/sf |
71 |
7 |
| Jan 30 |
37 |
$1,218/sf |
70 |
6 |
| Feb 6 |
34 |
$1,236/sf |
75 |
12 |
| Feb 13 |
43 |
$1,333/sf |
68 |
11 |
| Feb 20 |
39 |
$1,392/sf |
71 |
18 |
| Feb 27 |
37 |
$1,323/sf |
68 |
22 |
| Mar 6 |
49 |
$1,222/sf |
56 |
20 |
| Mar 13 |
49 |
$1,312/sf |
49 |
22 |
| Mar 20 |
46 |
$1,321/sf |
52 |
25 |
| Mar 27 |
50 |
$1,329/sf |
52 |
25 |
| Apr 3 |
49 |
$1,342/sf |
51 |
23 |
| Apr 10 |
50 |
$1,321/sf |
57 |
24 |
| Apr 17 |
47 |
$1,342/sf |
59 |
26 |
| Apr 24 |
49 |
$1,281/sf |
63 |
28 |
| May 1 |
53 |
$1,227/sf |
62 |
23 |
| May 8 |
55 |
$1,122/sf |
63 |
19 |
| May 15 |
57 |
$1,211/sf |
59 |
19 |
| May 22 |
59 |
$1,170/sf |
61 |
19 |
| May 29 |
60 |
$1,171/sf |
60 |
17 |
| Jun 5 |
70 |
$1,178/sf |
55 |
15 |
| Jun 12 |
64 |
$1,198/sf |
53 |
18 |
| Jun 19 |
67 |
$1,184/sf |
54 |
20 |
| Jun 26 |
66 |
$1,204/sf |
58 |
25 |
| Jul 3 |
63 |
$1,215/sf |
58 |
22 |
| Jul 10 |
72 |
$1,204/sf |
59 |
23 |
| Jul 17 |
79 |
$1,173/sf |
64 |
22 |
| Jul 24 |
78 |
$1,182/sf |
63 |
23 |
| Jul 31 |
69 |
$1,181/sf |
66 |
22 |
| Aug 7 |
72 |
$1,214/sf |
65 |
19 |
| Aug 14 |
65 |
$1,224/sf |
67 |
26 |
| Aug 21 |
66 |
$1,236/sf |
57 |
24 |
| Aug 28 |
64 |
$1,232/sf |
64 |
20 |
| Sep 4 |
59 |
$1,215/sf |
70 |
21 |
| Sep 11 |
50 |
$1,134/sf |
78 |
22 |
| Sep 18 |
46 |
$1,150/sf |
80 |
20 |
| Sep 25 |
47 |
$1,182/sf |
84 |
20 |
| Oct 2 |
45 |
$1,221/sf |
80 |
15 |
| Oct 9 |
47 |
$1,205/sf |
75 |
10 |
| Oct 16 |
49 |
$1,192/sf |
80 |
15 |
| Oct 23 |
49 |
$1,201/sf |
71 |
13 |
| Oct 30 |
47 |
$1,191/sf |
73 |
14 |
The $4,000,000+ Market:
| Date |
NSDCC Active Listings |
Avg. LP/sf |
Avg. DOM |
# of Pendings |
| Jan 2, 2023 |
121 |
$1,744/sf |
126 |
21 |
| Jan 9 |
119 |
$1,716/sf |
123 |
20 |
| Jan 16 |
120 |
$1,761/sf |
121 |
26 |
| Jan 23 |
122 |
$1,707/sf |
119 |
27 |
| Jan 30 |
120 |
$1,680/sf |
121 |
30 |
| Feb 6 |
125 |
$1,714/sf |
118 |
28 |
| Feb 13 |
121 |
$1,750/sf |
116 |
32 |
| Feb 20 |
129 |
$1,725/sf |
112 |
33 |
| Feb 27 |
124 |
$1,743/sf |
115 |
31 |
| Mar 6 |
122 |
$1,753/sf |
109 |
28 |
| Mar 13 |
120 |
$1,782/sf |
109 |
32 |
| Mar 20 |
129 |
$1,783/sf |
106 |
28 |
| Mar 27 |
127 |
$1,781/sf |
106 |
27 |
| Apr 3 |
131 |
$1,774/sf |
105 |
27 |
| Apr 10 |
136 |
$1,788/sf |
107 |
24 |
| Apr 17 |
140 |
$1,776/sf |
108 |
27 |
| Apr 24 |
141 |
$1,771/sf |
107 |
31 |
| May 1 |
142 |
$1,760/sf |
105 |
30 |
| May 8 |
140 |
$1,737/sf |
104 |
32 |
| May 15 |
141 |
$1,812/sf |
107 |
37 |
| May 22 |
145 |
$1,816/sf |
106 |
29 |
| May 29 |
142 |
$1,846/sf |
110 |
36 |
| Jun 5 |
152 |
$1,791/sf |
107 |
31 |
| Jun 12 |
163 |
$1,777/sf |
106 |
24 |
| Jun 19 |
166 |
$1,779/sf |
102 |
26 |
| Jun 26 |
179 |
$1,758/sf |
98 |
29 |
| Jul 3 |
184 |
$1,670/sf |
91 |
39 |
| Jul 10 |
192 |
$1,653/sf |
92 |
42 |
| Jul 17 |
187 |
$1,666/sf |
94 |
47 |
| Jul 24 |
185 |
$1,668/sf |
98 |
49 |
| Jul 31 |
184 |
$1,653/sf |
102 |
51 |
| Aug 7 |
178 |
$1,639/sf |
101 |
51 |
| Aug 14 |
182 |
$1,625/sf |
106 |
45 |
| Aug 21 |
177 |
$1,612/sf |
100 |
43 |
| Aug 28 |
181 |
$1,644/sf |
106 |
40 |
| Sep 4 |
179 |
$1,646/sf |
109 |
32 |
| Sep 11 |
177 |
$1,683/sf |
105 |
32 |
| Sep 18 |
169 |
$1,660/sf |
106 |
29 |
| Sep 25 |
183 |
$1,662/sf |
106 |
27 |
| Oct 2 |
180 |
$1,676/sf |
107 |
25 |
| Oct 9 |
190 |
$1,647/sf |
103 |
30 |
| Oct 16 |
185 |
$1,613/sf |
104 |
33 |
| Oct 23 |
181 |
$1,655/sf |
106 |
32 |
| Oct 30 |
184 |
$1,618/sf |
107 |
31 |
NSDCC Weekly New Listings and New Pendings
| Week |
New Listings |
New Pendings |
Total Actives |
Total Pendings |
| Jan 2, 2023 |
11 |
6 |
263 |
89 |
| Jan 9 |
36 |
15 |
277 |
88 |
| Jan 16 |
36 |
34 |
266 |
114 |
| Jan 23 |
36 |
22 |
269 |
116 |
| Jan 30 |
32 |
25 |
272 |
123 |
| Feb 6 |
46 |
33 |
275 |
131 |
| Feb 13 |
30 |
35 |
265 |
150 |
| Feb 20 |
43 |
34 |
274 |
158 |
| Feb 27 |
27 |
30 |
260 |
165 |
| Mar 6 |
45 |
28 |
276 |
150 |
| Mar 13 |
38 |
38 |
274 |
154 |
| Mar 20 |
39 |
37 |
265 |
164 |
| Mar 27 |
36 |
25 |
267 |
153 |
| Apr 3 |
37 |
28 |
271 |
143 |
| Apr 10 |
36 |
39 |
272 |
151 |
| Apr 17 |
47 |
27 |
291 |
157 |
| Apr 24 |
46 |
41 |
282 |
167 |
| May 1 |
59 |
31 |
288 |
159 |
| May 8 |
53 |
26 |
310 |
151 |
| May 15 |
48 |
31 |
315 |
157 |
| May 22 |
50 |
24 |
332 |
145 |
| May 29 |
43 |
37 |
325 |
154 |
| Jun 5 |
43 |
17 |
352 |
137 |
| Jun 12 |
52 |
36 |
357 |
146 |
| Jun 19 |
48 |
30 |
369 |
143 |
| Jun 26 |
65 |
26 |
391 |
148 |
| Jul 3 |
60 |
48 |
394 |
166 |
| Jul 10 |
51 |
34 |
415 |
176 |
| Jul 17 |
55 |
28 |
430 |
173 |
| Jul 24 |
37 |
43 |
419 |
184 |
| Jul 31 |
48 |
44 |
399 |
187 |
| Aug 7 |
43 |
32 |
390 |
181 |
| Aug 14 |
36 |
24 |
384 |
178 |
| Aug 21 |
41 |
45 |
371 |
187 |
| Aug 28 |
37 |
27 |
395 |
177 |
| Sep 4 |
35 |
29 |
378 |
155 |
| Sep 11 |
40 |
30 |
373 |
155 |
| Sep 18 |
37 |
29 |
369 |
145 |
| Sep 25 |
39 |
20 |
382 |
141 |
| Oct 2 |
44 |
31 |
372 |
132 |
| Oct 9 |
45 |
23 |
384 |
127 |
| Oct 16 |
31 |
23 |
381 |
126 |
| Oct 23 |
36 |
26 |
379 |
131 |
| Oct 30 |
28 |
17 |
371 |
125 |
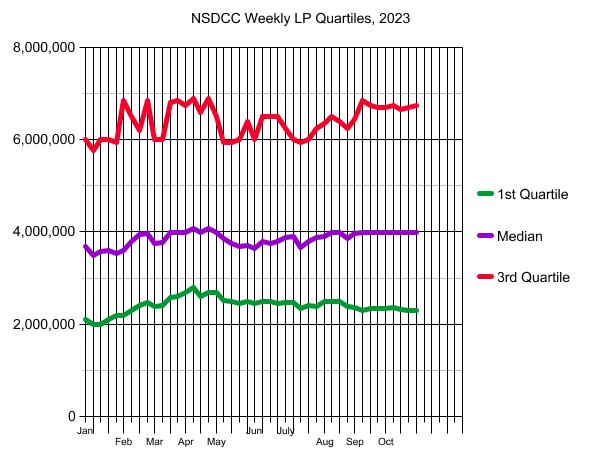
NSDCC Weekly LP Quartiles
| Week |
1st Quartile |
2nd Quartile (Median LP) |
3rd Quartile |
| Jan 2, 2023 |
$2,095,000 |
$3,695,000 |
$5,995,000 |
| Jan 9 |
$1,990,000 |
$3,495,000 |
$5,775,000 |
| Jan 16 |
$2,000,000 |
$3,574,000 |
$5,995,000 |
| Jan 23 |
$2,099,000 |
$3,595,000 |
$5,999,000 |
| Jan 30 |
$2,195,000 |
$3,525,000 |
$5,942,000 |
| Feb 6 |
$2,195,000 |
$3,598,000 |
$6,845,000 |
| Feb 13 |
$2,300,000 |
$3,795,000 |
$6,495,000 |
| Feb 20 |
$2,397,500 |
$3,950,000 |
$6,197,500 |
| Feb 27 |
$2,480,800 |
$3,970,000 |
$6,845,000 |
| Mar 6 |
$2,395,000 |
$3,749,500 |
$5,995,000 |
| Mar 13 |
$2,397,000 |
$3,772,500 |
$5,997,000 |
| Mar 20 |
$2,580,000 |
$3,995,000 |
$6,800,000 |
| Mar 27 |
$2,595,000 |
$3,995,000 |
$6,845,000 |
| Apr 3 |
$2,699,000 |
$3,995,000 |
$6,750,000 |
| Apr 10 |
$2,799,500 |
$4,074,997 |
$6,895,000 |
| Apr 17 |
$2,600,000 |
$3,995,000 |
$6,597,000 |
| Apr 24 |
$2,685,000 |
$4,074,997 |
$6,895,000 |
| May 1 |
$2,695,000 |
$3,999,000 |
$6,495,000 |
| May 8 |
$2,525,000 |
$3,849,949 |
$5,946,000 |
| May 15 |
$2,495,000 |
$3,749,400 |
$5,950,000 |
| May 22 |
$2,444,000 |
$3,695,400 |
$6,000,000 |
| May 29 |
$2,495,000 |
$3,699,000 |
$6,395,000 |
| Jun 5 |
$2,450,000 |
$3,641,500 |
$6,000,000 |
| Jun 12 |
$2,499,900 |
$3,799,999 |
$6,496,000 |
| Jun 19 |
$2,495,000 |
$3,750,000 |
$6,497,000 |
| Jun 26 |
$2,450,000 |
$3,799,000 |
$6,495,000 |
| Jul 3 |
$2,479,000 |
$3,891,500 |
$6,235,000 |
| Jul 10 |
$2,468,000 |
$3,900,000 |
$5,998,985 |
| Jul 17 |
$2,350,000 |
$3,669,000 |
$5,949,000 |
| Jul 24 |
$2,399,000 |
$3,799,999 |
$5,995,000 |
| Jul 31 |
$2,395,000 |
$3,888,000 |
$6,245,000 |
| Aug 7 |
$2,492,000 |
$3,895,000 |
$6,345,000 |
| Aug 14 |
$2,495,000 |
$3,995,000 |
$6,499,000 |
| Aug 21 |
$2,499,000 |
$3,995,000 |
$6,395,000 |
| Aug 28 |
$2,395,000 |
$3,850,000 |
$6,245,000 |
| Sep 4 |
$2,372,500 |
$3,957,500 |
$6,446,500 |
| Sep 11 |
$2,299,500 |
$3,995.000 |
$6,845,000 |
| Sep 18 |
$2,349,600 |
$3,995,000 |
$6,750,000 |
| Sep 25 |
$2,349,500 |
$3,991,500 |
$6,695,000 |
| Oct 2 |
$2,350,000 |
$3,995,000 |
$6,700,000 |
| Oct 9 |
$2,372,500 |
$3,999,450 |
$6,750,000 |
| Oct 16 |
$2,325,000 |
$3,995,000 |
$6,650,000 |
| Oct 23 |
$2,299,000 |
$3,995,000 |
$6,695,000 |
| Oct 30 |
$2,300,000 |
$3,999,000 |
$6,750,000 |


Few people who have ever lived know the U.S. housing market better than Amherst’s CEO Sean Dobson. During his 37-year career, the Texan has done everything from amassing a fortune by betting against the U.S. housing market prior to the 2008 crash to growing Amherst’s single-family portfolio to over 44,000 homes.
“We picked up the financial crisis in 2005 and 2006. So we stood up a bunch of different strategies around what later became called The Big Short.” Before the crash, Dobson had spent most of his career in mortgages and mortgage-backed securities. However, over the past 12 years, he has redirected his massive real estate intelligence operation to concentrate on purchasing what he refers to as “real assets” meaning single-family homes.
Here’s how Dobson explains Amherst’s business model: “We buy homes one at a time through our own brokerage platform, using all our data analytics to do the asset selection, market selection, and return forecasting, but then we have a brokerage platform which sources homes and underwrites them. The construction management business is completely vertically integrated and does all the renovations, and then we have a national property management infrastructure that leases them up and provides resident services.”
Dobson has had a front row seat amid the pandemic era housing frenzy, which saw inventory across the nation dry up. That dearth of inventory, in Dobson’s view, is the defining feature of today’s housing market.
“During the pandemic what was happening is that new listings volume was pretty healthy, there were plenty of people coming to market for sale, but the velocity at which they were selling was so fast that it was drawing down the inventory. Now it’s completely flipped. The pace to draw down inventory on a percentage basis is healthy, but there is just no one selling. The new listings volume has just crashed so now inventory is getting drawn down by lack of supply instead of excess demand.”
“There’s a supply issue, and just a lack of supply, and that’s going to drift listings volume lower over time.”
Do you believe new listings haven’t bottomed yet?
His response: “We have one of the best prepayment models in the world, and a big function is forecasting [housing] turnover. And turnover is driven by a bunch of things: it’s the switch cost, it’s the equity in the home, it’s the tenure of the homes… so we can probably have a good idea of what turnover is going to be. If housing turnover in the past was running at 6% or 7% per year, it’s probably going to run at half that now. That’s [just] people selling for natural reasons – death, divorce, etc. But I don’t think this [new listings] is close to bottoming out.”
Where does he think U.S. house prices, which are facing the headwind of deteriorated affordability, are going?
“I’d say whatever our forecast is, it has a wider range of error than it normally would have. We’re just at a point in the [housing] market to where I don’t think anyone really knows to tell you the truth,” Dobson says. But, he adds, we can’t ignore that inventory remains down over 40% since pre-pandemic.
If strained affordability is the headwind, then the lack of supply is the tailwind.
“It’s one of these markets where the fundamentals [like price-to-rent ratios] aren’t great, but the technicals are unbelievable,” Dobson says. What are the technicals? He says the dearth of supply, and also the fact that “it’s very expensive to build” new single-family housing stock.
I might suggest Angelo Mozilo knew more than Sean Dobson but…
Anyway, two points. His company owning 44,000 SFRs might be part of the low supply. Companies rarely divorce, get too old, etc. Second, inflation. As Dobson noted, replacement/new costs are prohibitive. As an investment right now who would want to sit on cash versus own real estate? Especially income generating Real Estate.
@rob Actually lots of people, with 5% interest your have the same or better ROI vs dealing with tenants.
No denying dealing with tenants. is a downside Still there are so many advantages; depreciation, deductions, asset appreciation (inflation hedge). And your 5%? Consider the effective rate of return with only 40% down instead of 100%. Even at barely positive cash flow including the mortgage there are still many positives.
Fixed income? Bought some Ts Friday. 3y 0.625% coupon on market with one year remaining. Paid 95¢ so my yield is 5.4%. Must have sucked for the original purchaser. Paid 98¢ earned 1.4¢ sold 95¢ two years net loss 1.6¢ and inflation erosion. I’m hoping to approximate inflation.
That’s the problem with fixed income products, no inflation hedge, in fact the reverse.