This should be about it.
If there hasn’t been a surge of inventory by now, it’s not coming – at least not this year.
There might be some nice action over the next couple of weeks as buyers try to land a deal before school starts, but there won’t be big discounts – they will have to pay the price.
It will probably be the same in 2023 too.
How do I know?
Ask any potential, or actual, home sellers around the coast:
“You already have to pay six figures in capital-gains taxes when selling your home (and if they are selling a home they have owned since the 1970s or 1980s, it could be $500,000 to $1,000,000 in taxes).
“How do you feel about lowering your price by $100,000 or $200,000 too?”
“How do you feel about losing that much money?”
Their answer will tell you everything about the future of our market – they’re not going to give it away!
It’s been the craziest six months of real estate ever! Expect it to get downright boring from here.
~~~~~~~~~~~~~~~~~~~~~~~~~~~~~~~~~~~
The $0 – $1,500,000 Market:
| Date |
NSDCC Active Listings |
Avg. LP/sf |
Avg. DOM |
# of Pendings |
| Jan 3, 2022 |
9 |
$832/sf |
35 |
36 |
| Jan 10 |
9 |
$766/sf |
28 |
29 |
| Jan 17 |
13 |
$773/sf |
26 |
27 |
| Jan 24 |
9 |
$818/sf |
15 |
29 |
| Jan 31 |
14 |
$752/sf |
14 |
31 |
| Feb 7 |
13 |
$774/sf |
12 |
32 |
| Feb 14 |
11 |
$826/sf |
12 |
35 |
| Feb 21 |
7 |
$889/sf |
17 |
38 |
| Feb 28 |
12 |
$888/sf |
17 |
33 |
| Mar 7 |
9 |
$1,017/sf |
21 |
33 |
| Mar 14 |
14 |
$847/sf |
18 |
31 |
| Mar 21 |
8 |
$912/sf |
26 |
36 |
| Mar 28 |
10 |
$914/sf |
25 |
28 |
| Apr 4 |
10 |
$782/sf |
33 |
34 |
| Apr 11 |
19 |
$733/sf |
21 |
36 |
| Apr 18 |
16 |
$795/sf |
28 |
34 |
| Apr 25 |
18 |
$891/sf |
27 |
30 |
| May 2 |
22 |
$822/sf |
23 |
31 |
| May 9 |
24 |
$887/sf |
17 |
46 |
| May 16 |
25 |
$783/sf |
22 |
25 |
| May 23 |
29 |
$782/sf |
23 |
29 |
| May 30 |
30 |
$782/sf |
24 |
28 |
| Jun 6 |
34 |
$763/sf |
25 |
28 |
| Jun 13 |
33 |
$802/sf |
29 |
29 |
| Jun 20 |
48 |
$774/sf |
28 |
22 |
| Jun 27 |
43 |
$755/sf |
32 |
22 |
| Jul 4 |
49 |
$757/sf |
33 |
23 |
The $1,500,000 – $2,000,000 Market:
| Date |
NSDCC Active Listings |
Avg. LP/sf |
Avg. DOM |
# of Pendings |
| Jan 3, 2022 |
8 |
$842/sf |
52 |
36 |
| Jan 10 |
13 |
$751/sf |
28 |
29 |
| Jan 17 |
16 |
$736/sf |
33 |
27 |
| Jan 24 |
16 |
$801/sf |
17 |
27 |
| Jan 31 |
15 |
$696/sf |
14 |
34 |
| Feb 7 |
15 |
$765/sf |
17 |
34 |
| Feb 14 |
10 |
$726/sf |
19 |
38 |
| Feb 21 |
19 |
$715/sf |
15 |
39 |
| Feb 28 |
9 |
$660/sf |
12 |
46 |
| Mar 7 |
16 |
$789/sf |
15 |
46 |
| Mar 14 |
17 |
$837/sf |
8 |
44 |
| Mar 21 |
18 |
$867/sf |
11 |
43 |
| Mar 28 |
14 |
$838/sf |
15 |
48 |
| Apr 4 |
18 |
$762/sf |
25 |
42 |
| Apr 11 |
23 |
$774/sf |
15 |
39 |
| Apr 18 |
22 |
$792/sf |
17 |
41 |
| Apr 25 |
18 |
$810/sf |
20 |
41 |
| May 2 |
27 |
$809/sf |
17 |
37 |
| May 9 |
33 |
$837/sf |
17 |
46 |
| May 16 |
39 |
$793/sf |
19 |
44 |
| May 23 |
43 |
$793/sf |
22 |
44 |
| May 30 |
36 |
$843/sf |
23 |
36 |
| Jun 6 |
43 |
$817/sf |
23 |
41 |
| Jun 13 |
49 |
$845/sf |
24 |
42 |
| Jun 20 |
57 |
$817/sf |
24 |
41 |
| Jun 27 |
75 |
$807/sf |
24 |
35 |
| Jul 4 |
70 |
$827/sf |
27 |
33 |
The $2,000,000 – $3,000,000 Market:
| Date |
NSDCC Active Listings |
Avg. LP/sf |
Avg. DOM |
# of Pendings |
| Jan 3, 2022 |
18 |
$1,080/sf |
127 |
43 |
| Jan 10 |
23 |
$1,038/sf |
85 |
37 |
| Jan 17 |
26 |
$1,044/sf |
80 |
41 |
| Jan 24 |
28 |
$1,015/sf |
37 |
42 |
| Jan 31 |
22 |
$949/sf |
38 |
47 |
| Feb 7 |
26 |
$919/sf |
29 |
42 |
| Feb 14 |
22 |
$997/sf |
37 |
49 |
| Feb 21 |
21 |
$966/sf |
33 |
54 |
| Feb 28 |
26 |
$905/sf |
32 |
57 |
| Mar 7 |
29 |
$922/sf |
28 |
57 |
| Mar 14 |
20 |
$852/sf |
26 |
58 |
| Mar 21 |
17 |
$928/sf |
26 |
60 |
| Mar 28 |
34 |
$927/sf |
12 |
65 |
| Apr 4 |
32 |
$927/sf |
20 |
69 |
| Apr 11 |
44 |
$910/sf |
17 |
62 |
| Apr 18 |
48 |
$997/sf |
19 |
66 |
| Apr 25 |
42 |
$1,092/sf |
18 |
73 |
| May 2 |
54 |
$995/sf |
19 |
70 |
| May 9 |
61 |
$910/sf |
20 |
73 |
| May 16 |
64 |
$977/sf |
22 |
69 |
| May 23 |
82 |
$953/sf |
25 |
59 |
| May 30 |
78 |
$951/sf |
27 |
56 |
| Jun 6 |
94 |
$963/sf |
27 |
58 |
| Jun 13 |
98 |
$961/sf |
28 |
70 |
| Jun 20 |
91 |
$935/sf |
32 |
59 |
| Jun 27 |
111 |
$894/sf |
30 |
60 |
| Jul |
112 |
$910/sf |
33 |
60 |
The $3,000,000 – $4,000,000 Market:
| Date |
NSDCC Active Listings |
Avg. LP/sf |
Avg. DOM |
# of Pendings |
| Jan 3, 2022 |
19 |
$1,230/sf |
90 |
26 |
| Jan 10 |
22 |
$1,210/sf |
76 |
25 |
| Jan 17 |
19 |
$1,207/sf |
86 |
23 |
| Jan 24 |
17 |
$1,129/sf |
92 |
24 |
| Jan 31 |
21 |
$1,172/sf |
70 |
22 |
| Feb 7 |
19 |
$1,169/sf |
67 |
25 |
| Feb 14 |
19 |
$1,234/sf |
65 |
28 |
| Feb 21 |
21 |
$1,279/sf |
69 |
28 |
| Feb 28 |
22 |
$1,214/sf |
64 |
25 |
| Mar 7 |
27 |
$1,295/sf |
60 |
24 |
| Mar 14 |
27 |
$1,201/sf |
65 |
27 |
| Mar 21 |
23 |
$1,282/sf |
69 |
31 |
| Mar 28 |
25 |
$1,253/sf |
67 |
30 |
| Apr 4 |
30 |
$1,199/sf |
61 |
27 |
| Apr 11 |
32 |
$1,174/sf |
62 |
31 |
| Apr 18 |
33 |
$1,216/sf |
68 |
31 |
| Apr 25 |
33 |
$1,219/sf |
63 |
33 |
| May 2 |
37 |
$1,164/sf |
50 |
36 |
| May 9 |
33 |
$1,132/sf |
57 |
32 |
| May 16 |
40 |
$1,119/sf |
53 |
32 |
| May 23 |
40 |
$1,135/sf |
57 |
27 |
| May 30 |
40 |
$1,178/sf |
61 |
28 |
| Jun 6 |
43 |
$1,224/sf |
56 |
28 |
| Jun 13 |
48 |
$1,184/sf |
52 |
28 |
| Jun 20 |
52 |
$1,117/sf |
53 |
26 |
| Jun 27 |
60 |
$1,120/sf |
51 |
19 |
| Jul 4 |
55 |
$1,127/sf |
58 |
23 |
The $4,000,000+ Market:
| Date |
NSDCC Active Listings |
Avg. LP/sf |
Avg. DOM |
# of Pendings |
| Jan 3, 2022 |
100 |
$1,884/sf |
128 |
30 |
| Jan 10 |
105 |
$1,864/sf |
113 |
29 |
| Jan 17 |
109 |
$1,763/sf |
110 |
34 |
| Jan 24 |
105 |
$2,130/sf |
114 |
42 |
| Jan 31 |
102 |
$2,114/sf |
118 |
53 |
| Feb 7 |
109 |
$2,000/sf |
108 |
50 |
| Feb 14 |
108 |
$2,005/sf |
109 |
47 |
| Feb 21 |
113 |
$2,008/sf |
103 |
43 |
| Feb 28 |
111 |
$1,991/sf |
101 |
47 |
| Mar 7 |
115 |
$1,904/sf |
91 |
39 |
| Mar 14 |
121 |
$1,893/sf |
95 |
43 |
| Mar 21 |
116 |
$1,905/sf |
97 |
44 |
| Mar 28 |
104 |
$1,966/sf |
97 |
59 |
| Apr 4 |
103 |
$1,929/sf |
97 |
56 |
| Apr 11 |
106 |
$1,906/sf |
97 |
55 |
| Apr 18 |
108 |
$1,874/sf |
100 |
51 |
| Apr 25 |
116 |
$1,829/sf |
97 |
38 |
| May 2 |
117 |
$1,781/sf |
95 |
32 |
| May 9 |
116 |
$1,831/sf |
96 |
36 |
| May 16 |
124 |
$1,854/sf |
91 |
39 |
| May 23 |
125 |
$1,855/sf |
92 |
36 |
| May 30 |
129 |
$1,706/sf |
93 |
39 |
| Jun 6 |
131 |
$1,740/sf |
89 |
33 |
| Jun 13 |
132 |
$1,793/sf |
86 |
38 |
| Jun 20 |
148 |
$1,772/sf |
84 |
35 |
| Jun 27 |
153 |
$1,779/sf |
87 |
29 |
| Jul 4 |
155 |
$1,777/sf |
82 |
25 |
NSDCC Weekly New Listings and New Pendings
| Week |
New Listings |
New Pendings |
Total Actives |
Total Pendings |
| Jan 3, 2022 |
17 |
14 |
152 |
164 |
| Jan 10 |
39 |
18 |
167 |
142 |
| Jan 17 |
34 |
29 |
179 |
145 |
| Jan 24 |
41 |
40 |
173 |
157 |
| Jan 31 |
43 |
40 |
173 |
182 |
| Feb 7 |
43 |
38 |
179 |
179 |
| Feb 14 |
44 |
49 |
168 |
193 |
| Feb 21 |
51 |
38 |
180 |
197 |
| Feb 28 |
39 |
39 |
179 |
205 |
| Mar 7 |
54 |
37 |
191 |
195 |
| Mar 14 |
48 |
51 |
195 |
196 |
| Mar 21 |
39 |
46 |
178 |
207 |
| Mar 28 |
53 |
50 |
185 |
224 |
| Apr 4 |
46 |
40 |
190 |
220 |
| Apr 11 |
61 |
39 |
221 |
213 |
| Apr 18 |
41 |
46 |
224 |
212 |
| Apr 25 |
50 |
43 |
224 |
205 |
| May 2 |
76 |
37 |
256 |
196 |
| May 9 |
59 |
46 |
262 |
207 |
| May 16 |
78 |
48 |
286 |
200 |
| May 23 |
61 |
42 |
312 |
192 |
| May 30 |
54 |
44 |
307 |
183 |
| Jun 6 |
70 |
31 |
338 |
183 |
| Jun 13 |
60 |
41 |
354 |
202 |
| Jun 20 |
71 |
25 |
388 |
177 |
| Jun 27 |
73 |
26 |
433 |
159 |
| Jul 4 |
55 |
39 |
432 |
158 |


CoreLogic has launched CitySnap in New York City. It is their trial run of their Zillow-alternative real estate search website that will funnel the buyer inquiries back to the listing agent himself, rather than to the Zillow Premier Agents who now pay 30% of their commission to Zillow for the service.
Here was my response on an insider website:
It will probably look like Homesnap, which isn’t better than Zillow/Redfin. But the consumers will flock there to find ‘new and exclusive’ inventory. That’s right, the listing agents will quit inputting their listings onto the MLS, and instead just use Homesnap only and have the buyer leads fed back to them for free. CoreLogic will probably charge the listing agent $250 to $500 per listing x 5 million homes sold every year.
No agent wants to pay 30% of their commission to Zillow for lousy buyer leads to assign to team members and hope they get lucky in the open market. This is a fantastic alternative that should catch on quick because the buyers are calling about my listing – big difference!
Unintended consequences: Single agency (where buyers get no actual representation, though they will sign an agency form allowing the listing agent to be dual agent), the end of buyer-agents which will drain the realtor population, and more reliance on automated valuations because no one is helping the buyers much.
Could this create a renaissance of buyer-only brokerages? Certainly the opportunity is there, but without the MLS they will have no product to sell.
Oh, you say realtors are obligated to input their listings onto the MLS? Myself and every agent would love to quit the MLS, the local board, the state board, and NAR today. They could all be out of business within the next 1-2 years.
Maybe I could create a new job category. Qualified buyer. I assume the buyer status representing the actual buyer. Honestly presenting the buyer’s… Oh wait, that’s a buyer’s agent already.
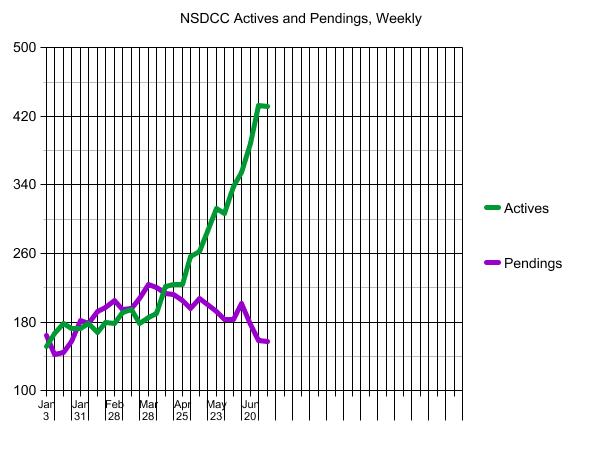
Hey Jim – Your line is going straight up, isn’t that a surge?
It’s just a surge of sellers who are holding out for their price, and buyers aren’t going for it yet.
But it’s not a surge of inventory, compared to historical numbers. These are the first NSDCC-inventory counts in July:
2014: 1,128
2015: 1,054
2016: 1,153
2017: 960
2018: 978
2019:1,029
2020: 755
2021: 356
2022: 432
Remember when the inventory plunged in 2020, and we thought the world was going to end? We’d have to at least get back to 2020 numbers before I’ll get nervous.