

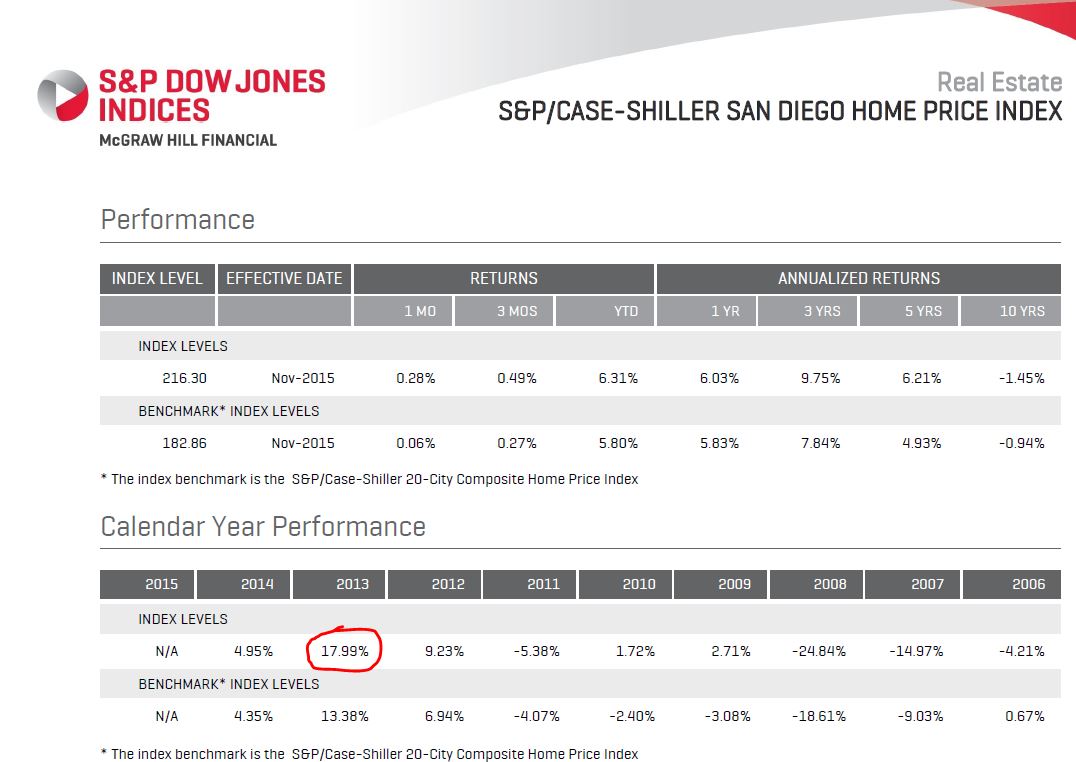
Four other towns experienced their all-time highs, but the San Diego Case-Shiller Index for November barely got off the mat, rising a scant 0.28% from October. It made up for the decline last month, and shows how general pricing data will bounce around from now on.
The talking heads will report how ‘prices’ went up or down, but that is a generalization. The index went up slightly, and that’s all we know.
Here are the San Diego NSA changes for 2015:
| Month | |||
| January | |||
| February | |||
| March | |||
| April | |||
| May | |||
| June | |||
| July | |||
| August | |||
| September | |||
| October | |||
| November |
I revised each monthly index today by a couple of basis points to reflect the exact amount reported on the Case-Shiller Index website. I get the data from the same place every month – I think they revised their numbers. The seasonaly-adjusted number is 216.04, so I’m sticking with the non-seasonally-adjusted. We don’t have ‘seasons’ that some ivory-tower guy can quantify.


0 Comments