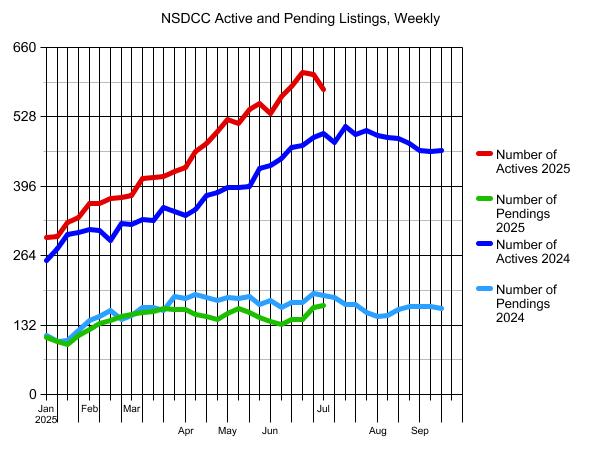
It looks like the inventory has finally peaked for 2025 – phew!
But it also means that there be fewer creampuffs – and more refreshed listings – coming to market the rest of the way. Think the inventory is stale now? It will most likely get worse.
Want to predict the future?
Look at the green line in the graph above. The pendings lagged a bit after Liberation Day, but bounced back in early May to pick up the pace again. If it weren’t for that blip, the pendings have mirrored the path from last year – and it will probably do the same the rest of the way.
Home sellers should get ‘er done now, rather than risk having to compete with a surge of inventory next year. In fact, I think we can re-define the selling season for the next few years.
Hot in January and February. Then sluggish the rest of the way as inventory loads up which causes the second half of the year to be particularly unnerving and less productive except for the sharks.
The $0 – $2,000,000 Market:
| Date |
NSDCC Active Listings |
Avg. LP/sf |
Avg. DOM |
# of Pendings |
| Jan 6, 2025 |
43 |
$918/sf |
63 |
27 |
| Jan 13 |
45 |
$936/sf |
53 |
22 |
| Jan 20 |
47 |
$908/sf |
54 |
25 |
| Jan 27 |
48 |
$904/sf |
48 |
32 |
| Feb 3 |
51 |
$914/sf |
47 |
41 |
| Feb 10 |
45 |
$935/sf |
46 |
45 |
| Feb 17 |
45 |
$916/sf |
46 |
46 |
| Feb 24 |
45 |
$958/sf |
48 |
40 |
| Mar 3 |
50 |
$950/sf |
37 |
42 |
| Mar 10 |
55 |
$908/sf |
36 |
45 |
| Mar 17 |
53 |
$891/sf |
35 |
50 |
| Mar 24 |
53 |
$898/sf |
30 |
51 |
| Mar 31 |
58 |
$878/sf |
35 |
44 |
| Apr 7 |
56 |
$867/sf |
30 |
43 |
| Apr 14 |
63 |
$906/sf |
32 |
40 |
| Apr 21 |
59 |
$936/sf |
35 |
37 |
| Apr 28 |
74 |
$899/sf |
32 |
39 |
| May 5 |
83 |
$907/sf |
30 |
47 |
| May 12 |
72 |
$916/sf |
34 |
44 |
| May 19 |
70 |
$898/sf |
38 |
51 |
| May 26 |
74 |
$923/sf |
39 |
43 |
| Jun 2 |
76 |
$912/sf |
39 |
36 |
| Jun 9 |
87 |
$939/sf |
38 |
36 |
| Jun 16 |
83 |
$922/sf |
41 |
48 |
| Jun 23 |
89 |
$930/sf |
46 |
52 |
| Jun 30 |
96 |
$938/sf |
42 |
57 |
| Jul 7 |
83 |
$944/sf |
45 |
63 |
The $2,000,000 – $3,000,000 Market:
| Date |
NSDCC Active Listings |
Avg. LP/sf |
Avg. DOM |
# of Pendings |
| Jan 6, 2025 |
55 |
$1,029/sf |
66 |
36 |
| Jan 13 |
58 |
$990/sf |
63 |
31 |
| Jan 20 |
64 |
$1,018/sf |
57 |
26 |
| Jan 27 |
64 |
$1,025/sf |
53 |
31 |
| Feb 3 |
71 |
$1,009/sf |
50 |
31 |
| Feb 10 |
75 |
$1,005/sf |
46 |
36 |
| Feb 17 |
81 |
$1,015/sf |
44 |
39 |
| Feb 24 |
80 |
$1,012/sf |
38 |
52 |
| Mar 3 |
80 |
$1,034/sf |
33 |
49 |
| Mar 10 |
92 |
$1,029/sf |
37 |
44 |
| Mar 17 |
98 |
$1,015/sf |
39 |
44 |
| Mar 24 |
98 |
$1,008/sf |
41 |
52 |
| Mar 31 |
100 |
$997/sf |
44 |
54 |
| Apr 7 |
94 |
$940/sf |
43 |
54 |
| Apr 14 |
96 |
$962/sf |
42 |
53 |
| Apr 21 |
107 |
$1,000/sf |
43 |
53 |
| Apr 28 |
109 |
$1,010/sf |
44 |
49 |
| May 5 |
124 |
$1,036/sf |
40 |
50 |
| May 12 |
120 |
$1,041/sf |
43 |
57 |
| May 19 |
133 |
$1,034/sf |
43 |
49 |
| May 26 |
133 |
$1,055/sf |
47 |
53 |
| Jun 2 |
140 |
$1,039/sf |
48 |
51 |
| Jun 9 |
149 |
$1,042/sf |
45 |
45 |
| Jun 16 |
157 |
$1,043/sf |
46 |
44 |
| Jun 23 |
163 |
$1,028/sf |
45 |
43 |
| Jun 30 |
156 |
$1,030/sf |
45 |
46 |
| Jul 7 |
144 |
$1,048/sf |
47 |
46 |
The $3,000,000 – $4,000,000 Market:
| Date |
NSDCC Active Listings |
Avg. LP/sf |
Avg. DOM |
# of Pendings |
| Jan 6, 2025 |
44 |
$1,091/sf |
82 |
19 |
| Jan 13 |
46 |
$1,122/sf |
77 |
19 |
| Jan 20 |
52 |
$1,156/sf |
70 |
16 |
| Jan 27 |
49 |
$1,197/sf |
67 |
20 |
| Feb 3 |
56 |
$1,182/sf |
55 |
21 |
| Feb 10 |
58 |
$1,158/sf |
51 |
25 |
| Feb 17 |
58 |
$1,179/sf |
54 |
24 |
| Feb 24 |
56 |
$1,168/sf |
52 |
24 |
| Mar 3 |
51 |
$1,147/sf |
56 |
31 |
| Mar 10 |
56 |
$1,240/sf |
61 |
34 |
| Mar 17 |
60 |
$1,209/sf |
61 |
36 |
| Mar 24 |
60 |
$1,209/sf |
62 |
39 |
| Mar 31 |
62 |
$1,158/sf |
64 |
34 |
| Apr 7 |
68 |
$1,208/sf |
59 |
34 |
| Apr 14 |
79 |
$1,193/sf |
55 |
26 |
| Apr 21 |
85 |
$1,230/sf |
54 |
28 |
| Apr 28 |
85 |
$1,198/sf |
53 |
28 |
| May 5 |
82 |
$1,179/sf |
56 |
28 |
| May 12 |
89 |
$1,148/sf |
53 |
30 |
| May 19 |
88 |
$1,161/sf |
56 |
28 |
| May 26 |
85 |
$1,157/sf |
58 |
26 |
| Jun 2 |
81 |
$1,162/sf |
58 |
22 |
| Jun 9 |
89 |
$1,146/sf |
58 |
21 |
| Jun 16 |
95 |
$1,107/sf |
56 |
17 |
| Jun 23 |
101 |
$1,146/sf |
58 |
18 |
| Jun 30 |
102 |
$1,192/sf |
56 |
24 |
| Jul 7 |
102 |
$1,176/sf |
55 |
21 |
The $4,000,000+ Market:
| Date |
NSDCC Active Listings |
Avg. LP/sf |
Avg. DOM |
# of Pendings |
| Jan 6, 2025 |
160 |
$1,822/sf |
105 |
27 |
| Jan 13 |
156 |
$1,868/sf |
105 |
31 |
| Jan 20 |
170 |
$1,936/sf |
95 |
29 |
| Jan 27 |
180 |
$1,877/sf |
90 |
31 |
| Feb 3 |
189 |
$1,884/sf |
85 |
31 |
| Feb 10 |
189 |
$1,864/sf |
88 |
29 |
| Feb 17 |
192 |
$1,875/sf |
90 |
32 |
| Feb 24 |
195 |
$1,869/sf |
91 |
34 |
| Mar 3 |
200 |
$1,860/sf |
87 |
34 |
| Mar 10 |
213 |
$1,811/sf |
83 |
36 |
| Mar 17 |
208 |
$1,755/sf |
85 |
30 |
| Mar 24 |
211 |
$1,800/sf |
86 |
25 |
| Mar 31 |
213 |
$1,784/sf |
90 |
32 |
| Apr 7 |
219 |
$1,777/sf |
90 |
33 |
| Apr 14 |
230 |
$1,790/sf |
87 |
35 |
| Apr 21 |
231 |
$1,792/sf |
87 |
32 |
| Apr 28 |
235 |
$1,772/sf |
88 |
28 |
| May 5 |
239 |
$1,811/sf |
82 |
30 |
| May 12 |
239 |
$1,811/sf |
85 |
33 |
| May 19 |
255 |
$1,773/sf |
85 |
29 |
| May 26 |
265 |
$1,759/sf |
87 |
24 |
| Jun 2 |
242 |
$1,745/sf |
90 |
29 |
| Jun 9 |
244 |
$1,774/sf |
90 |
33 |
| Jun 16 |
254 |
$1,766/sf |
88 |
34 |
| Jun 23 |
265 |
$1,787/sf |
91 |
30 |
| Jun 30 |
260 |
$1,786/sf |
92 |
40 |
| Jul 7 |
257 |
$1,720/sf |
95 |
41 |
NSDCC Weekly New Listings and New Pendings
| Week |
New Listings |
New Pendings |
Total Actives |
Total Pendings |
| Jan 6 |
27 |
11 |
298 |
108 |
| Jan 13 |
38 |
26 |
301 |
101 |
| Jan 20 |
55 |
16 |
328 |
95 |
| Jan 27 |
60 |
32 |
337 |
113 |
| Feb 3 |
72 |
28 |
363 |
123 |
| Feb 10 |
50 |
34 |
364 |
135 |
| Feb 17 |
50 |
29 |
373 |
140 |
| Feb 24 |
58 |
38 |
374 |
148 |
| Mar 3 |
60 |
31 |
378 |
152 |
| Mar 10 |
60 |
30 |
411 |
156 |
| Mar 17 |
49 |
37 |
413 |
157 |
| Mar 24 |
57 |
39 |
414 |
164 |
| Mar 31 |
47 |
27 |
425 |
162 |
| Apr 7 |
52 |
31 |
431 |
162 |
| Apr 14 |
70 |
28 |
462 |
153 |
| Apr 21 |
58 |
24 |
478 |
148 |
| Apr 28 |
71 |
30 |
501 |
143 |
| May 5 |
82 |
37 |
524 |
154 |
| May 12 |
56 |
39 |
516 |
163 |
| May 19 |
54 |
20 |
543 |
156 |
| May 26 |
58 |
29 |
554 |
146 |
| Jun 2 |
41 |
22 |
535 |
138 |
| Jun 9 |
62 |
25 |
566 |
134 |
| Jun 16 |
68 |
32 |
585 |
142 |
| Jun 23 |
65 |
26 |
612 |
142 |
| Jun 30 |
55 |
37 |
608 |
166 |
| Jul 7 |
43 |
31 |
580 |
169 |
NSDCC List Price Quartiles
| Week |
1st Quartile |
Median List Price |
3rd Quartile |
| Jan 6 |
$2,685,000 |
$4,472,500 |
$7,995,000 |
| Jan 13 |
$2,499,000 |
$4,250,000 |
$7,750,000 |
| Jan 20 |
$2,695,000 |
$4,300,000 |
$7,767,000 |
| Jan 27 |
$2,795,000 |
$4,498,000 |
$7,995,000 |
| Feb 3 |
$2,695,000 |
$4,350,000 |
$7,499,000 |
| Feb 10 |
$2,799,000 |
$4,299,000 |
$7,695,000 |
| Feb 17 |
$2,695,000 |
$4,200,000 |
$7,750,000 |
| Feb 24 |
$2,699,500 |
$4,250,000 |
$7,645,000 |
| Mar 3 |
$2,550,000 |
$4,375,000 |
$7,497,000 |
| Mar 10 |
$2,500,000 |
$4,200,000 |
$7,250,000 |
| Mar 17 |
$2,500,000 |
$4,000,000 |
$6,995,000 |
| Mar 24 |
$2,595,000 |
$4,047,500 |
$7,275,000 |
| Mar 31 |
$2,499,000 |
$4,000,000 |
$7,300,000 |
| Apr 7 |
$2,500,000 |
$4,000,000 |
$6,995,000 |
| Apr 14 |
$2,500,000 |
$3,999,000 |
$6,995,000 |
| Apr 21 |
$2,590,000 |
$3,995,000 |
$6,799,500 |
| Apr 28 |
$2,490,000 |
$3,988,000 |
$6,500,000 |
| May 5 |
$2,395,000 |
$3,795,000 |
$6,495,000 |
| May 12 |
$2,495,000 |
$3,895,000 |
$6,500,000 |
| May 19 |
$2,495,000 |
$3,950,000 |
$6,595,000 |
| May 26 |
$2,495,000 |
$3,984,500 |
$6,547,500 |
| Jun 2 |
$2,395,000 |
$3,799,000 |
$6,295,500 |
| Jun 9 |
$2,300,000 |
$3,649,000 |
$5,998,500 |
| Jun 16 |
$2,395,000 |
$3,649,000 |
$5,999,000 |
| Jun 23 |
$2,395,000 |
$3,649,500 |
$5,999,500 |
| Jun 30 |
$2,300,000 |
$3,598,500 |
$5,999,000 |
| Jul 7 |
$2,395,000 |
$3,695,500 |
$6,100,000 |


0 Comments