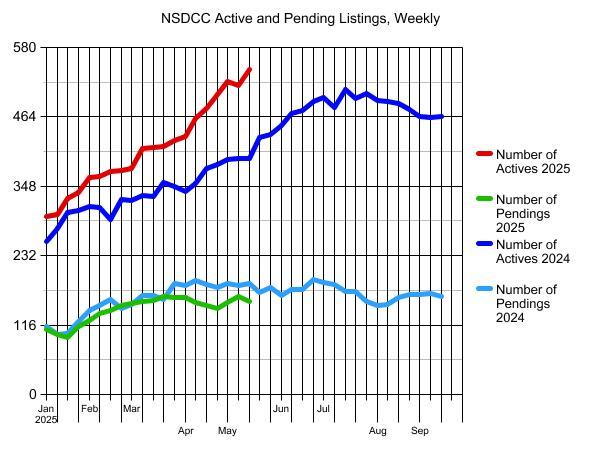
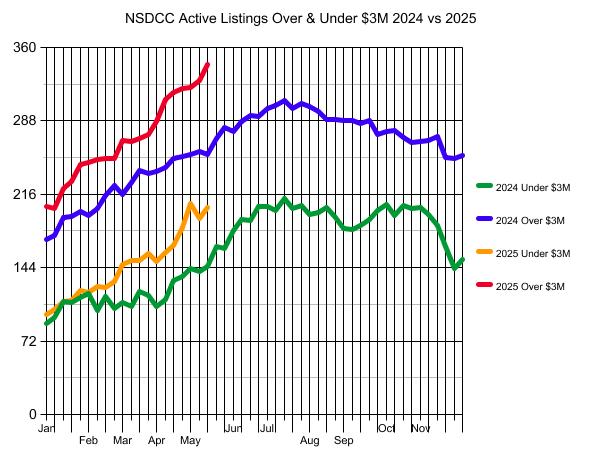
Of today’s 156 pendings, there are 100 of them that are priced Under-$3,000,000, which would make you think the inventory struggle might be a higher-end thing. But as you can see below, the number of active listings Under-$3,000,000 keeps climbing and is well ahead of last year’s counts too.
No changes are expected.
Sellers will let it ride and hope to get lucky. Buyers wonder if prices will drop.
The graduation season is underway, which is a welcome distraction for many. Then people will start going on vacations. Mortgage rates will stay high, and might go higher.
Creating any momentum or urgency will be exceedingly difficult.
The Big Wait is upon us, and likely to stick around!
The $0 – $2,000,000 Market:
| Date |
NSDCC Active Listings |
Avg. LP/sf |
Avg. DOM |
# of Pendings |
| Jan 6, 2025 |
43 |
$918/sf |
63 |
27 |
| Jan 13 |
45 |
$936/sf |
53 |
22 |
| Jan 20 |
47 |
$908/sf |
54 |
25 |
| Jan 27 |
48 |
$904/sf |
48 |
32 |
| Feb 3 |
51 |
$914/sf |
47 |
41 |
| Feb 10 |
45 |
$935/sf |
46 |
45 |
| Feb 17 |
45 |
$916/sf |
46 |
46 |
| Feb 24 |
45 |
$958/sf |
48 |
40 |
| Mar 3 |
50 |
$950/sf |
37 |
42 |
| Mar 10 |
55 |
$908/sf |
36 |
45 |
| Mar 17 |
53 |
$891/sf |
35 |
50 |
| Mar 24 |
53 |
$898/sf |
30 |
51 |
| Mar 31 |
58 |
$878/sf |
35 |
44 |
| Apr 7 |
56 |
$867/sf |
30 |
43 |
| Apr 14 |
63 |
$906/sf |
32 |
40 |
| Apr 21 |
59 |
$936/sf |
35 |
37 |
| Apr 28 |
74 |
$899/sf |
32 |
39 |
| May 5 |
83 |
$907/sf |
30 |
47 |
| May 12 |
72 |
$916/sf |
34 |
44 |
| May 19 |
70 |
$898/sf |
38 |
51 |
The $2,000,000 – $3,000,000 Market:
| Date |
NSDCC Active Listings |
Avg. LP/sf |
Avg. DOM |
# of Pendings |
| Jan 6, 2025 |
55 |
$1,029/sf |
66 |
36 |
| Jan 13 |
58 |
$990/sf |
63 |
31 |
| Jan 20 |
64 |
$1,018/sf |
57 |
26 |
| Jan 27 |
64 |
$1,025/sf |
53 |
31 |
| Feb 3 |
71 |
$1,009/sf |
50 |
31 |
| Feb 10 |
75 |
$1,005/sf |
46 |
36 |
| Feb 17 |
81 |
$1,015/sf |
44 |
39 |
| Feb 24 |
80 |
$1,012/sf |
38 |
52 |
| Mar 3 |
80 |
$1,034/sf |
33 |
49 |
| Mar 10 |
92 |
$1,029/sf |
37 |
44 |
| Mar 17 |
98 |
$1,015/sf |
39 |
44 |
| Mar 24 |
98 |
$1,008/sf |
41 |
52 |
| Mar 31 |
100 |
$997/sf |
44 |
54 |
| Apr 7 |
94 |
$940/sf |
43 |
54 |
| Apr 14 |
96 |
$962/sf |
42 |
53 |
| Apr 21 |
107 |
$1,000/sf |
43 |
53 |
| Apr 28 |
109 |
$1,010/sf |
44 |
49 |
| May 5 |
124 |
$1,036/sf |
40 |
50 |
| May 12 |
120 |
$1,041/sf |
43 |
57 |
| May 19 |
133 |
$1,034/sf |
43 |
49 |
The $3,000,000 – $4,000,000 Market:
| Date |
NSDCC Active Listings |
Avg. LP/sf |
Avg. DOM |
# of Pendings |
| Jan 6, 2025 |
44 |
$1,091/sf |
82 |
19 |
| Jan 13 |
46 |
$1,122/sf |
77 |
19 |
| Jan 20 |
52 |
$1,156/sf |
70 |
16 |
| Jan 27 |
49 |
$1,197/sf |
67 |
20 |
| Feb 3 |
56 |
$1,182/sf |
55 |
21 |
| Feb 10 |
58 |
$1,158/sf |
51 |
25 |
| Feb 17 |
58 |
$1,179/sf |
54 |
24 |
| Feb 24 |
56 |
$1,168/sf |
52 |
24 |
| Mar 3 |
51 |
$1,147/sf |
56 |
31 |
| Mar 10 |
56 |
$1,240/sf |
61 |
34 |
| Mar 17 |
60 |
$1,209/sf |
61 |
36 |
| Mar 24 |
60 |
$1,209/sf |
62 |
39 |
| Mar 31 |
62 |
$1,158/sf |
64 |
34 |
| Apr 7 |
68 |
$1,208/sf |
59 |
34 |
| Apr 14 |
79 |
$1,193/sf |
55 |
26 |
| Apr 21 |
85 |
$1,230/sf |
54 |
28 |
| Apr 28 |
85 |
$1,198/sf |
53 |
28 |
| May 5 |
82 |
$1,179/sf |
56 |
28 |
| May 12 |
89 |
$1,148/sf |
53 |
30 |
| May 19 |
88 |
$1,161/sf |
56 |
28 |
The $4,000,000+ Market:
| Date |
NSDCC Active Listings |
Avg. LP/sf |
Avg. DOM |
# of Pendings |
| Jan 6, 2025 |
160 |
$1,822/sf |
105 |
27 |
| Jan 13 |
156 |
$1,868/sf |
105 |
31 |
| Jan 20 |
170 |
$1,936/sf |
95 |
29 |
| Jan 27 |
180 |
$1,877/sf |
90 |
31 |
| Feb 3 |
189 |
$1,884/sf |
85 |
31 |
| Feb 10 |
189 |
$1,864/sf |
88 |
29 |
| Feb 17 |
192 |
$1,875/sf |
90 |
32 |
| Feb 24 |
195 |
$1,869/sf |
91 |
34 |
| Mar 3 |
200 |
$1,860/sf |
87 |
34 |
| Mar 10 |
213 |
$1,811/sf |
83 |
36 |
| Mar 17 |
208 |
$1,755/sf |
85 |
30 |
| Mar 24 |
211 |
$1,800/sf |
86 |
25 |
| Mar 31 |
213 |
$1,784/sf |
90 |
32 |
| Apr 7 |
219 |
$1,777/sf |
90 |
33 |
| Apr 14 |
230 |
$1,790/sf |
87 |
35 |
| Apr 21 |
231 |
$1,792/sf |
87 |
32 |
| Apr 28 |
235 |
$1,772/sf |
88 |
28 |
| May 5 |
239 |
$1,811/sf |
82 |
30 |
| May 12 |
239 |
$1,811/sf |
85 |
33 |
| May 19 |
255 |
$1,773/sf |
85 |
29 |
NSDCC Weekly New Listings and New Pendings
| Week |
New Listings |
New Pendings |
Total Actives |
Total Pendings |
| Jan 6 |
27 |
11 |
298 |
108 |
| Jan 13 |
38 |
26 |
301 |
101 |
| Jan 20 |
55 |
16 |
328 |
95 |
| Jan 27 |
60 |
32 |
337 |
113 |
| Feb 3 |
72 |
28 |
363 |
123 |
| Feb 10 |
50 |
34 |
364 |
135 |
| Feb 17 |
50 |
29 |
373 |
140 |
| Feb 24 |
58 |
38 |
374 |
148 |
| Mar 3 |
60 |
31 |
378 |
152 |
| Mar 10 |
60 |
30 |
411 |
156 |
| Mar 17 |
49 |
37 |
413 |
157 |
| Mar 24 |
57 |
39 |
414 |
164 |
| Mar 31 |
47 |
27 |
425 |
162 |
| Apr 7 |
52 |
31 |
431 |
162 |
| Apr 14 |
70 |
28 |
462 |
153 |
| Apr 21 |
58 |
24 |
478 |
148 |
| Apr 28 |
71 |
30 |
501 |
143 |
| May 5 |
82 |
37 |
524 |
154 |
| May 12 |
56 |
39 |
516 |
163 |
| May 19 |
54 |
20 |
543 |
156 |
NSDCC List Price Quartiles
| Week |
1st Quartile |
Median List Price |
3rd Quartile |
| Jan 6 |
$2,685,000 |
$4,472,500 |
$7,995,000 |
| Jan 13 |
$2,499,000 |
$4,250,000 |
$7,750,000 |
| Jan 20 |
$2,695,000 |
$4,300,000 |
$7,767,000 |
| Jan 27 |
$2,795,000 |
$4,498,000 |
$7,995,000 |
| Feb 3 |
$2,695,000 |
$4,350,000 |
$7,499,000 |
| Feb 10 |
$2,799,000 |
$4,299,000 |
$7,695,000 |
| Feb 17 |
$2,695,000 |
$4,200,000 |
$7,750,000 |
| Feb 24 |
$2,699,500 |
$4,250,000 |
$7,645,000 |
| Mar 3 |
$2,550,000 |
$4,375,000 |
$7,497,000 |
| Mar 10 |
$2,500,000 |
$4,200,000 |
$7,250,000 |
| Mar 17 |
$2,500,000 |
$4,000,000 |
$6,995,000 |
| Mar 24 |
$2,595,000 |
$4,047,500 |
$7,275,000 |
| Mar 31 |
$2,499,000 |
$4,000,000 |
$7,300,000 |
| Apr 7 |
$2,500,000 |
$4,000,000 |
$6,995,000 |
| Apr 14 |
$2,500,000 |
$3,999,000 |
$6,995,000 |
| Apr 21 |
$2,590,000 |
$3,995,000 |
$6,799,500 |
| Apr 28 |
$2,490,000 |
$3,988,000 |
$6,500,000 |
| May 5 |
$2,395,000 |
$3,795,000 |
$6,495,000 |
| May 12 |
$2,495,000 |
$3,895,000 |
$6,500,000 |
| May 19 |
$2,495,000 |
$3,950,000 |
$6,595,000 |


0 Comments