

I counted 32 NSDCC houses for sale on the Compass private exclusives list that aren’t on the MLS. They aren’t well-organized – just a one-liner list for the whole county – and they are mostly homes being prepared for market, or tenant-occupied, or old listings that are taking a breather. Photos and remarks are optional, and there isn’t any push from management to actually be selling them off-market.
But it they were actively on the market, the NSDCC inventory count today would be 406 which is where I thought we would be by the end of February.
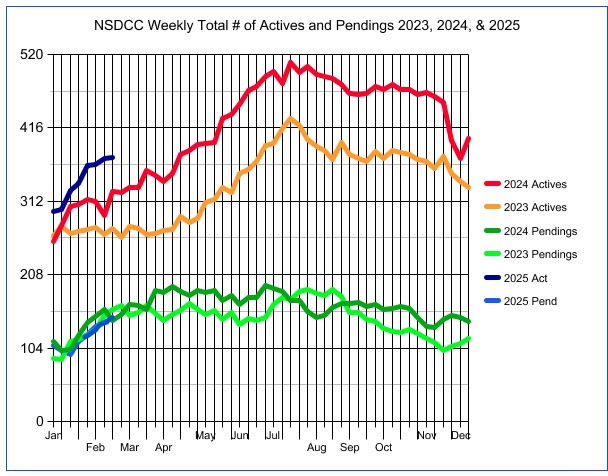
NSDCC Detached-Home Listings Between Jan. 1 and Feb. 20th
2019: 662
2020: 620
2021: 517
2022: 384
2023: 334
2024: 399
2025: 429 (+8% YoY so far)
This year’s count will continue to grow as new listings taken before the 20th keep hitting the open market over the next week or two. There only needs to be 30 more to reach the +15% mark, and if you want to add the private exclusives then we are already there.
Hard to belive that Saturday is March 1st. This is prime selling season!
The $0 – $2,000,000 Market:
| Date | ||||
| Jan 6, 2025 | ||||
| Jan 13 | ||||
| Jan 20 | ||||
| Jan 27 | ||||
| Feb 3 | ||||
| Feb 10 | ||||
| Feb 17 | ||||
| Feb 24 |
The $2,000,000 – $3,000,000 Market:
| Date | ||||
| Jan 6, 2025 | ||||
| Jan 13 | ||||
| Jan 20 | ||||
| Jan 27 | ||||
| Feb 3 | ||||
| Feb 10 | ||||
| Feb 17 | ||||
| Feb 24 |
The $3,000,000 – $4,000,000 Market:
| Date | ||||
| Jan 6, 2025 | ||||
| Jan 13 | ||||
| Jan 20 | ||||
| Jan 27 | ||||
| Feb 3 | ||||
| Feb 10 | ||||
| Feb 17 | ||||
| Feb 24 |
The $4,000,000+ Market:
| Date | ||||
| Jan 6, 2025 | ||||
| Jan 13 | ||||
| Jan 20 | ||||
| Jan 27 | ||||
| Feb 3 | ||||
| Feb 10 | ||||
| Feb 17 | ||||
| Feb 24 |
NSDCC Weekly New Listings and New Pendings
| Week | ||||
| Jan 6 | ||||
| Jan 13 | ||||
| Jan 20 | ||||
| Jan 27 | ||||
| Feb 3 | ||||
| Feb 10 | ||||
| Feb 17 | ||||
| Feb 24 |
NSDCC List Price Quartiles
| Week | |||
| Jan 6 | |||
| Jan 13 | |||
| Jan 20 | |||
| Jan 27 | |||
| Feb 3 | |||
| Feb 10 | |||
| Feb 17 | |||
| Feb 24 |


0 Comments