

When comparing to the last reading there hasn’t been much change, but the May 12th numbers were quite different – the number of actives today is now 15% higher, and pendings are 16% lower.
But it had to go in that direction. The March-May period has to be the hottest stretch ever recorded:
NSDCC Actives and Pendings
| Town or Area | |||||||
| Cardiff | |||||||
| Carlsbad NW | |||||||
| Carlsbad SE | |||||||
| Carlsbad NE | |||||||
| Carlsbad SW | |||||||
| Carmel Valley | |||||||
| Del Mar | |||||||
| Encinitas | |||||||
| La Jolla | |||||||
| RSF | |||||||
| RSF | |||||||
| Solana Beach | |||||||
| NSDCC |
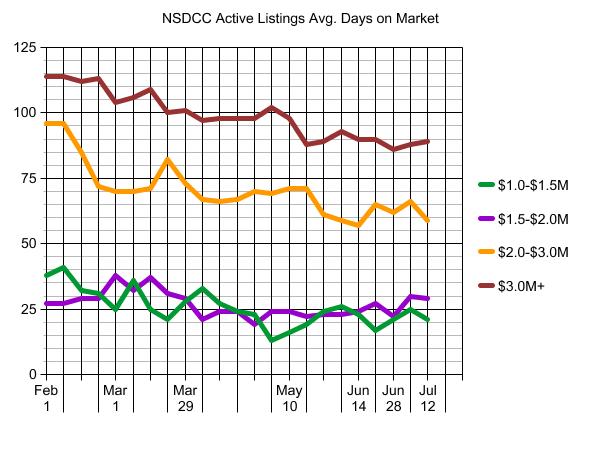
We can also track the average market times too. Any upward trends here would indicate market slowing:
We could get a nice flare-up of activity as the summer closes out, and it probably won’t be that obvious in these stats as the frenzy simmers down slowly over the next few weeks.


0 Comments