by Jim the Realtor | Sep 2, 2021 | 2021, Frenzy, North County Coastal, NSDCC Pendings, Sales and Price Check |
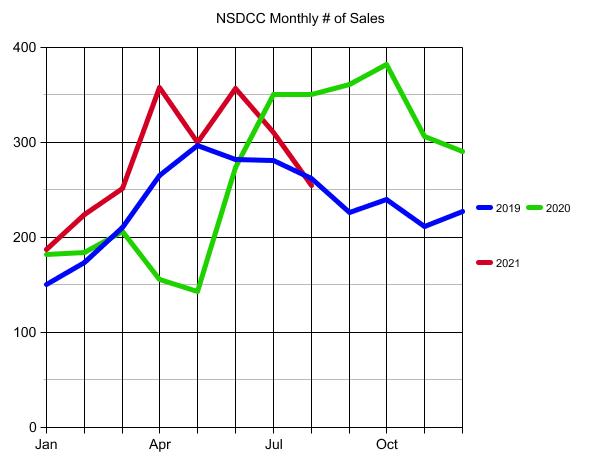
This year, we are ahead of both of the previous years in total sales, in spite of having 14% fewer listings – and prices being 30% to 40% higher!
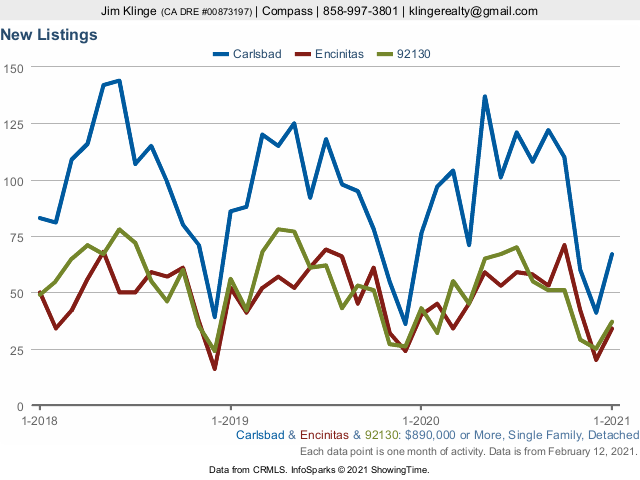
NSDCC Listings & Sales, Jan 1 to Aug 31
| Year |
# of Listings Between Jan 1 – Aug 31 |
# of Sales |
S/L % |
Median SP |
| 2019 |
3,585 |
1,922 |
54% |
$1,310,000 |
| 2020 |
3,245 |
1,846 |
57% |
$1,409,677 |
| 2021 |
2,805 |
2,245 |
80% |
$1,875,000 |
Prices probably need to go a bit higher to slow this thing down!
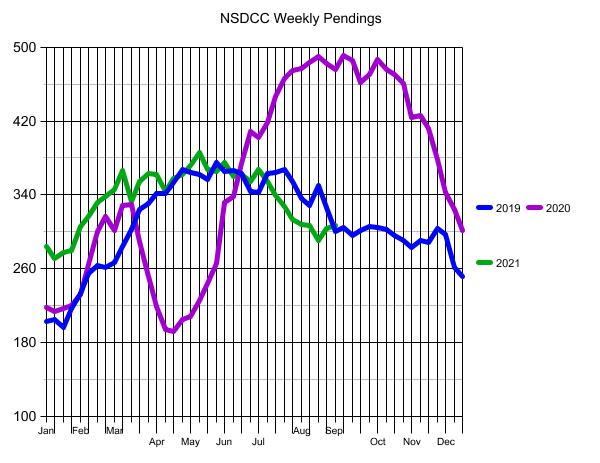
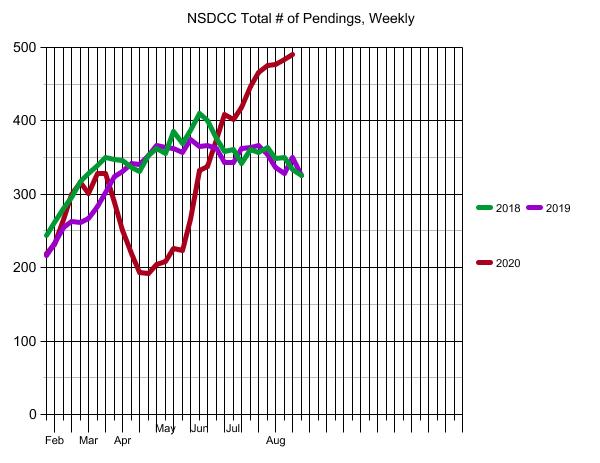
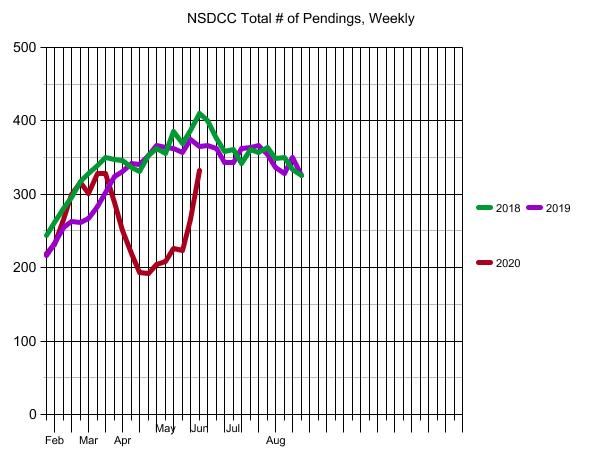
The NSDCC Weekly Pendings are tracking similar to 2019, so there should still be some gas in the tank:
by Jim the Realtor | Apr 5, 2021 | Inventory, North County Coastal, NSDCC Pendings |
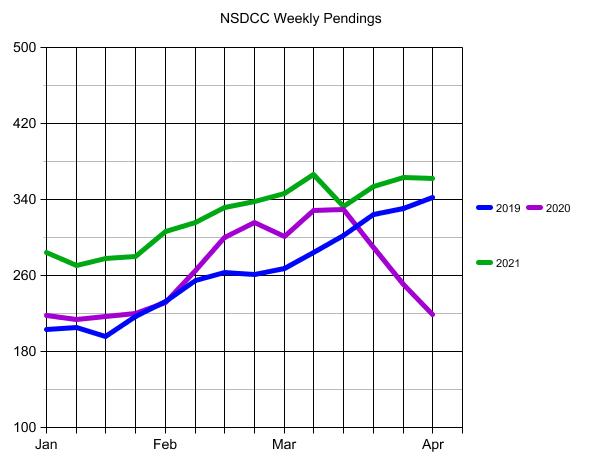
Did you get concerned about the pending index falling another 10% last week?
The U.S. housing market is suffering from its lowest supply in history, and that is taking an increasingly hard toll on sales.
Pending home sales, a measure of signed contracts on existing homes, fell a wider-than-expected 10.6% in February compared with January, according to the National Association of Realtors. Sales were 0.5% lower year over year.
“The demand for a home purchase is widespread, multiple offers are prevalent, and days-on-market are swift,” said the Realtor’s chief economist, Lawrence Yun. “But contracts are not clicking due to record-low inventory.”
The pendings between La Jolla and Carlsbad are doing just fine. In spite of the total number of NSDCC homes for sale being fewer than usual, people are still buying at a torrid pace:
Our market was helped by having more homes for sale.
New NSDCC Listings in the First Quarter:
2019: 1,278
2020: 922
2021: 1,081
After the first two months of this year, the total number of NSDCC new listings was 26% behind 2019.
But we had a big March, and the number of new listings in 1Q21 is only 15% behind those in 2019.
~~~~~~~~~~~~~~~~~~~~~~~~~~~~~~~~~~~~~~~~~~~~~~~
(more…)
by Jim the Realtor | Mar 16, 2021 | Actives/Pendings, Market Conditions, Market Surge, North County Coastal, NSDCC Pendings |

Previously we experienced a healthy market when actives outnumbered pendings 2:1. Then as the market heated up, we got used to the 1:1 ratio. Now we have areas where the ratio is more than 1:2!
NSDCC Detached-Home Active and Pending Listings
| Town or Area |
Zip Code |
Actives |
Pendings |
| Cardiff |
92007 |
10 |
14 |
| NW Carlsbad |
92008 |
15 |
24 |
| SE Carlsbad |
92009 |
20 |
48 |
| NE Carlsbad |
92010 |
4 |
11 |
| SW Carlsbad |
92011 |
4 |
19 |
| Carmel Valley |
92130 |
25 |
38 |
| Del Mar |
92014 |
32 |
25 |
| Encinitas |
92024 |
36 |
48 |
| La Jolla |
92037 |
95 |
45 |
| RSF |
67+91 |
87 |
50 |
| Solana Beach |
92075 |
8 |
9 |
| NSDCC |
All Above |
336 |
331 |
| West RB |
92127 |
24 |
63 |
| Scripps Ranch |
92131 |
6 |
25 |
What can buyers do?
Going inland doesn’t help – the 92127 and 92131 are hotter than ever.
Just go up in price – La Jolla is nice this time of year!
We will re-visit these numbers in the coming months.
by Jim the Realtor | Feb 23, 2021 | Actives/Pendings, Jim's Take on the Market, Market Buzz, Market Conditions, Market Surge, North County Coastal, NSDCC Pendings, Spring Kick |
This morning we have more homes in escrow than we have for sale!
NSDCC Detached-Home Listings
| Listing Status |
# of Listings |
Median List Price |
| Active |
352 |
$3,950,000 |
| Pending |
353 |
$1,925,000 |
Once upon a time I was discussing the actives/pendings relationship with local agent Peter B. He agreed that a 2:1 ratio of actives to pendings was a sign of a healthy market. If 2:1 was healthy, what is 1:1?
One thing that’s happening is that the action is rising into the upper price ranges. Today we have 94 homes in escrow that are priced over $3,000,000, which I doubt we’ve ever had before.
If we don’t see a surge of more listings, the pendings could extend its lead in the coming days/weeks!
~~~~~~~~~~~~~~~~~~~~~~~~~~~~~~~~~~~~
by Jim the Realtor | Feb 22, 2021 | Inventory, Jim's Take on the Market, North County Coastal, NSDCC Pendings |

We are getting close to a remarkable event – having more pendings than actives.
Here’s the current scorecard – 359 Actives, and 338 Pendings!
NSDCC Actives and Pendings
| Price Range |
Active Listings |
Avg $$/sf |
Pending Listings |
Avg $$/sf |
| 0-$1.0M |
6 |
$424/sf |
33 |
$640/sf |
| $1.0M – $1.5M |
22 |
$677/sf |
70 |
$605/sf |
| $1.5M – $2.0M |
45 |
$686/sf |
87 |
$621/sf |
| $2.0-$3.0M |
65 |
$871/sf |
68 |
$759/sf |
| $3.0M+ |
224 |
$1,404/sf |
87 |
$1,020/sf |
WE HAVE MORE PENDINGS THAN ACTIVES IN EVERY CATEGORY EXCEPT OVER-$3,000,000!
~~~~~~~~~~~~~~~~~~~~~~~~~~~~~~~~~~~~~~~~~~~~~~~
(more…)
by Jim the Realtor | Feb 12, 2021 | Actives/Pendings, Market Surge, North County Coastal, NSDCC Pendings |
When you look at the general data, the 25% dip year-over-year of January listings doesn’t look so bad – especially on a graph. Heck, we’re in the middle of a pandemic!
But look how it is playing out:
NSDCC Detached-Home New Listings
| Price Range |
New Listings in January |
# of Those Pend/Sold |
Pend/Sold Median DOM |
| Under $1.5M |
85 |
75 |
5 |
| Over $1.5M |
189 |
98 |
6 |
The lower-end is smoking hot where virtually all listings have found a buyer (88%), and for the higher-end to have most of the January listings go pending already is astonishing!
This has to be the best performing market of all-time!
~~~~~~~~~~~~~~~~~~~~
by Jim the Realtor | Dec 21, 2020 | Inventory, Jim's Take on the Market, North County Coastal, NSDCC Pendings |

The pendings count has been mirroring the actives pretty closely since mid-October, with the best example during election week when they moved about the same amount in opposite directions.
With fewer listings and more sales, the failure rate this year has been lower than ever. Historically we’ve had around 40% of listings NOT sell, but this year it’s closer to 30%:
Sales/Listings
2018: 2,814/4,864 = 0.58
2019: 2,838/4,773 = 0.59
2020: 3,106/4,480 = 0.69 (+17% yoy)
Though all prices ranges have benefited, the action has been heaviest on the lower-end.
We have 87 NSDCC homes for sale UNDER $2,000,000 today, and 338 OVER! The Median is $3,692,500!
Get Good Help!
~~~~~~~~~~~~~~~~~~~~~~~~~~~~
(more…)
by Jim the Realtor | Aug 17, 2020 | Actives/Pendings, Inventory, Jim's Take on the Market, NSDCC Pendings |
In previous years, the action is winding down by mid-August.
Not this year!
We’ve seen more pendings than actives in the lower price ranges. This week it happened for the first time in the $1,500,000 – $2,000,000 range:
NSDCC Actives and Pendings
| Price Range |
Active Listings |
Avg. LP/sf |
Pending Listings |
Avg LP/sf |
| $0-$1.0M |
28 |
$533/sf |
67 |
$506/sf |
| $1.0M-$1.5M |
113 |
$608/sf |
158 |
$518/sf |
| $1.5M-$2.0M |
123 |
$714/sf |
126 |
$630/sf |
| $2.0M-$3.0M |
137 |
$823/sf |
87 |
$729/sf |
Let’s note the differences.
Last year at this time, we had 199 actives and 79 pendings between $1,500,000 – $2,000,000.
On June 1st, we had 162 actives and 76 pendings.
Now it’s 123 vs. 126!
(more…)
by Jim the Realtor | Jul 2, 2020 | Actives/Pendings, Jim's Take on the Market, North County Coastal, NSDCC Pendings |
We saw those fancy graphs yesterday that compared the San Diego region to others nearby, and it appeared that the markets have slowed slightly. But let’s isolate on the La Jolla-to-Carlsbad area.
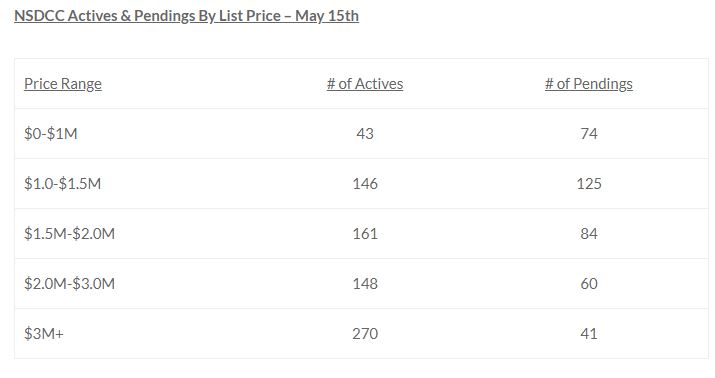
The chart above is from May 15th – here are the same categories today:
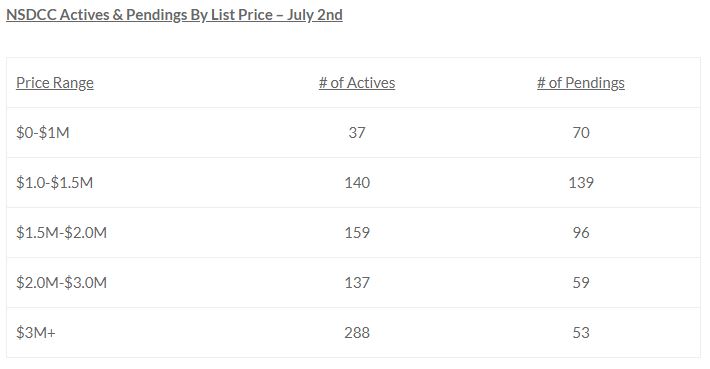
No slowdown here, especially in the $1.0M to $2.0M range where we have 26 more pendings today than we had 2.5 weeks ago. How about the additional 12 pendings in the $3.0M+ range?
by Jim the Realtor | Jun 1, 2020 | Inventory, Jim's Take on the Market, North County Coastal, NSDCC Pendings, Spring Kick |
THE TOTAL NUMBER OF NSDCC PENDINGS WENT UP 25% IN THE LAST WEEK!
(more…)


