by Jim the Realtor | Feb 25, 2019 | Actives/Pendings, Contests, Inventory, Jim's Take on the Market, NSDCC Pendings |
Thanks Rob Dawg for the gift!
Our contest for Padres tickets got more exciting this week due to Manny Mania!
NSDCC New Listings Jan 1 to Feb 20:
2018: 681
2019: 644 (-5%)
The two-month total last year was 783, so we’re on a pace to hit 741. Doughboy guessed 740, but it came in after the guessing period ended. If he wins, I’ll give tickets to him and the next closest guesser.
Others who guessed under 800:
755 – Neil
777 – Bb
785 – Recordsclerk
799 – TominLaCosta
We finally hit a statistical oddity that we’ve been flirting with for months. The average list-price-per-sf of the Under-$1,000,000 category caught up with the next category, $1.0M to $1.5M.
Both are at $494/sf today!
There was another quirk also. The new listings AND the new pendings both dropped off over the past week, which is unusual for this time of year. It must have been due to the rain?
The total number of pendings today is 18% behind last year.
Looking ahead to next month? It starts Friday! We had 446 new listings in March of last year, which was 25% more than in February, 2018.
(more…)
by Jim the Realtor | Feb 3, 2019 | Actives/Pendings, Jim's Take on the Market
Active/Pending stats for detached-homes between La Jolla and Carlsbad:
| Reading Date |
Actives |
Pendings |
A+P |
A/P |
| Oct 28, 2015 |
970 |
358 |
1,328 |
2.71 |
| Feb 1, 2016 |
788 |
254 |
1,042 |
3.10 |
| Mar 23, 2016 |
900 |
399 |
1,299 |
2.26 |
| June 21, 2016 |
1,052 |
428 |
1,480 |
2.46 |
| Aug 17, 2016 |
1,060 |
395 |
1,455 |
2.68 |
| Dec 4, 2016 |
886 |
327 |
1,213 |
2.71 |
| Apr 21, 2017 |
842 |
427 |
1,269 |
1.97 |
| July 16, 2018 |
973 |
357 |
1,330 |
2.73 |
| Oct 28, 2018 |
985 |
297 |
1,282 |
3.31 |
| Feb 3, 2019 |
774 |
232 |
1,006 |
3.34 |
NSDCC Actives Median List Price = $2,250,000 in October. It’s $2,275,000 today.
NSDCC Pendings Median LP = $1,399,000 in October. It’s $1,312,500 today.
The pendings are just a little slower, but we’re about the same as in 2016. We’ve had it so good for so long, we really shouldn’t be concerned if the market backs off a tad from here. Let’s check again towards the end of March!
Here are the Actives/Pendings ratios for each area:
| Area |
Zip Code |
June 2016 |
Aug |
Dec |
Apr 2017 |
July 2018 |
Oct |
Feb 2019 |
| Cardiff |
92007 |
2.3 |
3.5 |
1.1 |
1.0 |
2.5 |
2.6 |
2.3 |
| Carlsbad NW |
92008 |
2.0 |
2.3 |
1.3 |
1.2 |
2.9 |
4.7 |
1.8 |
| Carlsbad SE |
92009 |
1.6 |
2.0 |
1.9 |
1.0 |
1.3 |
2.8 |
1.9 |
| Carlsbad NE |
92010 |
0.7 |
0.9 |
1.3 |
0.9 |
1.1 |
2.2 |
1.4 |
| Carlsbad SW |
92011 |
1.6 |
1.5 |
1.3 |
1.1 |
2.4 |
1.3 |
1.4 |
| Del Mar |
92014 |
3.2 |
2.5 |
4.9 |
3.3 |
9.4 |
6.6 |
7.1 |
| Encinitas |
92024 |
1.3 |
1.8 |
1.8 |
1.6 |
2.0 |
2.0 |
2.1 |
| La Jolla |
92037 |
4.8 |
4.4 |
4.4 |
3.7 |
4.4 |
4.8 |
6.3 |
| RSF |
92067 |
8.2 |
6.3 |
6.3 |
5.2 |
4.6 |
4.8 |
10.5 |
| Solana Bch |
92075 |
2.9 |
3.9 |
2.7 |
1.5 |
2.0 |
4.0 |
7.7 |
| Carmel Vly |
92130 |
1.5 |
1.8 |
1.8 |
1.1 |
1.9 |
3.0 |
2.4 |
| All Above |
All |
2.5 |
2.7 |
2.7 |
2.0 |
2.7 |
3.3 |
3.3 |
It’s a random selection of dates, but no real big concerns here. The higher-end areas (especially Rancho Santa Fe) don’t worry themselves with the law of supply and demand – they just wait their turn. The rest look fine.
by Jim the Realtor | Nov 27, 2018 | Actives/Pendings, Jim's Take on the Market, North County Coastal, NSDCC Pendings, Tax Reform |

Today the FHFA announced that they have raised the Fannie/Freddie mortgage limit to $726,525 in high-cost areas:
Link to Article
With deductible mortgage interest now capped at $750,000 by the I.R.S., buyers who are concerned about write-offs will want to keep their new loan balance in the $700,000s.
The strict equation is $750,000/80% = $937,500.
If buyers find a house priced higher, they could come up with more cash to make up the difference, or they could get a jumbo loan at roughly the same interest rate and live with the non-deductible interest paid on the loan amount above $750,000.
It makes the ideal purchase price in the $1,000,000-$1,100,000 range.
If the tax reform is a big concern for buyers as some have suggested, the homes priced in the $1,100,000 – $1,500,000 might feel it. Buyers above that range weren’t expecting as much benefit anyway, and probably won’t be as impacted – but theoretically there are fewer buyers the higher we go.
Out of curiosity, let’s keep an eye on the NSDCC stats.
Today’s NSDCC Actives and Pendings:
$700,000-$1,100,000: 121/72 = 1.68
$1,100,000-$1,500,000: 157/75 = 2.09
$1,500,000-$2,500,000: 243/81 = 3.00
$2,500,000 and higher: 399/44 = 9.07
The market has been healthy up to $1,500,000 roughly, and like Rob Dawg said yesterday, potential buyers may not know the exact impact of the tax reform until they start on their 2018 tax returns in spring.
Let’s come back then and check for impact!
by Jim the Realtor | Oct 28, 2018 | Actives/Pendings, Jim's Take on the Market
Here are the stats for the NSDCC detached-home market (La Jolla to Carlsbad):
| Reading Date |
Actives |
Pendings |
A+P |
A/P |
| Oct 28, 2015 |
970 |
358 |
1,328 |
2.71 |
| Feb 1, 2016 |
788 |
254 |
1,042 |
3.10 |
| Mar 23, 2016 |
900 |
399 |
1,299 |
2.26 |
| June 21, 2016 |
1,052 |
428 |
1,480 |
2.46 |
| Aug 17, 2016 |
1,060 |
395 |
1,455 |
2.68 |
| Dec 4, 2016 |
886 |
327 |
1,213 |
2.71 |
| Apr 21, 2017 |
842 |
427 |
1,269 |
1.97 |
| July 16, 2018 |
973 |
357 |
1,330 |
2.73 |
| Oct 28, 2018 |
985 |
297 |
1,282 |
3.31 |
NSDCC Actives Median Price = $2,250,000
NSDCC Pendings Median Price = $1,399,000
Only 12% of the actives are under $1,000,000, and 33% are over $3,000,000 (was 10% and 35% last reading). You could say pricing has slid down 2% since July, but pricing stats are just good for trend-watching over the long haul.
The 3.31 ratio is the highest on the chart, and if it was due to an explosion of active (unsold) listings, it would be more troubling. If more homeowners were nervous, we’d see a higher total of listings today, instead of waiting for spring.
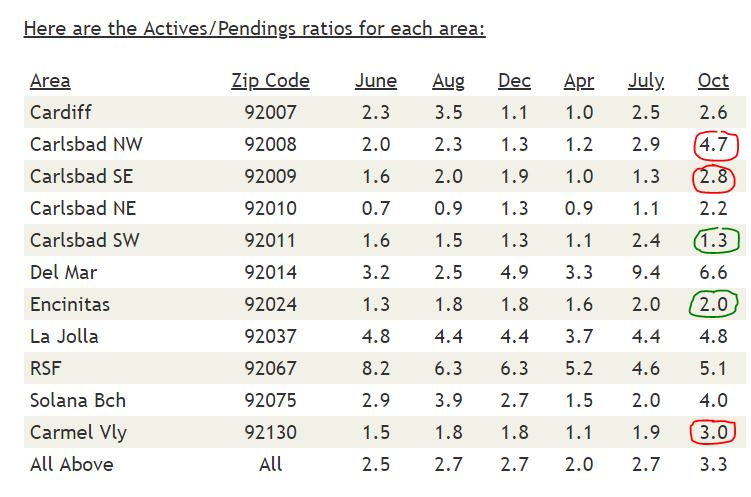
The areas in red have had prices go up too fast, and sellers are holding out.
Areas circled in green are active and healthy.
The Del Mar and Solana Beach samples are smaller and will be more volatile.
by Jim the Realtor | Oct 22, 2018 | Actives/Pendings, Inventory, Jim's Take on the Market
The total number of pendings went up 2% this week, and the number of closed sales for the first half of October (116) is higher than last year (114).
Statistically, the market is ‘fine’ up to the $1,600,000s.
The actives/pendings count for NSDCC listings priced under $1,650,000 is 355/183, or almost exactly the 2:1 ratio we use to describe a healthy market.
It may feel like a bit of a struggle now, but the distractions have just begun. Halloween is next week!

(more…)
by Jim the Realtor | Sep 17, 2018 | Actives/Pendings, Jim's Take on the Market, Market Conditions, Rich Toscano |
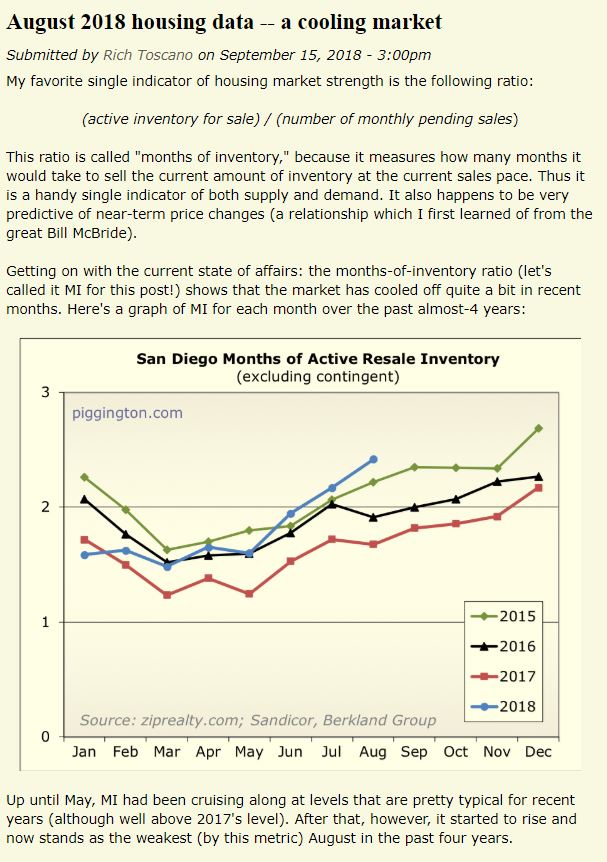
More here:
https://www.piggington.com/august_2018_housing_data_cooling_market
by Jim the Realtor | Jul 16, 2018 | Actives/Pendings, Jim's Take on the Market, North County Coastal, NSDCC Pendings
Historically, we have considered our market to be relatively ‘healthy’ when the actives-to-pendings ratio is around 2.0 – but that thought originated when prices were about half of what they are today!
But all in all, we’re in pretty good shape today.
The active inventory hasn’t exploded, and as long as the supply stays in check, the sellers aren’t going to panic. Do the buyers have the willingness and ability to wait it out, with no assurance it will ever get better? Or will the lack of solid evidence keep the ball rolling, albeit at a slower pace?
Here are the stats for the NSDCC detached-home market (La Jolla to Carlsbad):
| Reading Date |
Actives |
Pendings |
A+P |
A/P |
| Oct 28, 2015 |
970 |
358 |
1,328 |
2.71 |
| Feb 1, 2016 |
788 |
254 |
1,042 |
3.10 |
| Mar 23, 2016 |
900 |
399 |
1,299 |
2.26 |
| June 21, 2016 |
1,052 |
428 |
1,480 |
2.46 |
| Aug 17, 2016 |
1,060 |
395 |
1,455 |
2.68 |
| Dec 4, 2016 |
886 |
327 |
1,213 |
2.71 |
| Apr 21, 2017 |
842 |
427 |
1,269 |
1.97 |
| July 16, 2018 |
973 |
357 |
1,330 |
2.73 |
NSDCC Actives Median Price = $2,288,045
NSDCC Pendings Median Price = $1,395,000
Only 10% of the actives are under $1,000,000, and 35% are over $3,000,000 (which are the same ratios as the last reading in April, 2017).
Here are the Actives/Pendings ratios for each area:
| Area |
Zip Code |
June |
Aug |
Dec |
Apr |
Act/Pend Today |
| Cardiff |
92007 |
2.3 |
3.5 |
1.1 |
1.0 |
2.5 |
| Carlsbad NW |
92008 |
2.0 |
2.3 |
1.3 |
1.2 |
2.9 |
| Carlsbad SE |
92009 |
1.6 |
2.0 |
1.9 |
1.0 |
1.3 |
| Carlsbad NE |
92010 |
0.7 |
0.9 |
1.3 |
0.9 |
1.1 |
| Carlsbad SW |
92011 |
1.6 |
1.5 |
1.3 |
1.1 |
2.4 |
| Del Mar |
92014 |
3.2 |
2.5 |
4.9 |
3.3 |
9.4 |
| Encinitas |
92024 |
1.3 |
1.8 |
1.8 |
1.6 |
2.0 |
| La Jolla |
92037 |
4.8 |
4.4 |
4.4 |
3.7 |
4.4 |
| RSF |
92067 |
8.2 |
6.3 |
6.3 |
5.2 |
4.6 |
| Solana Bch |
92075 |
2.9 |
3.9 |
2.7 |
1.5 |
2.0 |
| Carmel Vly |
92130 |
1.5 |
1.8 |
1.8 |
1.1 |
1.9 |
| All Above |
All |
2.5 |
2.7 |
2.7 |
2.0 |
2.7 |
These stats are going to bounce around, so there isn’t anything here that gets me overly concerned.
Del Mar has always been a smaller, expensive subset (just eight pendings today), La Jolla is in line with their recent past, and RSF is as good as it’s been in years. Everything else is around the regular 2.0 ratio for a normal market.
by Jim the Realtor | Jun 11, 2018 | Actives/Pendings, Inventory, Jim's Take on the Market, North County Coastal
Last week we saw that the current inventory ranges from 1.3 months’ worth on the lower-end, to more than 10 months on the high end.
Another gauge we’ve used is to compare the active listings to the pendings, which also shows a similar condition. It’s been red hot on the lower-end, and not so much on the high end.
In normal markets in the past, the active listings have out-numbered the pendings by a 2:1 ratio. Today, the mid-ranges look fairly normal:
| Price Range |
NSDCC Actives |
Pendings |
Actives/Pendings Ratio |
| $0-$1M |
81 |
91 |
0.89 to 1 |
| $1M-$1.5M |
199 |
142 |
1.4 to 1 |
| $1.5M-$2M |
158 |
83 |
1.9 to 1 |
| $2M+ |
502 |
99 |
5.1 to 1 |
Here’s another way to look at it:
More than half (55%) of the active inventory is listed over $2,000,000, and about three-quarters of the pendings (77%) are listed under $2 million!
(more…)
by Jim the Realtor | Jan 15, 2018 | Actives/Pendings, Inventory, Jim's Take on the Market

We’ve said that the low-end of each market has been hopping – look at the market for houses priced under $1,500,000 between La Jolla and Carlsbad:
The NSDCC Under-$1,500,000 Market
Active listings: 135 Pending listings: 128
The actives-to-pendings ratio of nearly 1:1 is impressive. The higher-end market is moving too – having this many pendings as we are coming into the selling season looks like a good start:
The NSDCC Over-$1,500,000 Market
Active listings: 460 Pending listings: 86
Most of the people who came to the open house on Saturday were just beginning their search. I think it’s going to be a good year!
(more…)
by Jim the Realtor | Aug 7, 2017 | Actives/Pendings, Inventory, Jim's Take on the Market
In spite of what seems to be a somewhat bloated end-of-summer inventory, the new pendings over the last three weeks have been very solid:
| Week |
New Listings |
New Pendings |
| Jul 24 |
86 |
61 |
| Jul 31 |
90 |
75 |
| Aug 7 |
99 |
71 |
If the new-pending counts stay above 50 through September, this might be the best year since 2013!
(more…)