by Jim the Realtor | Jul 1, 2020 | Actives/Pendings, Jim's Take on the Market, Market Conditions, Market Surge
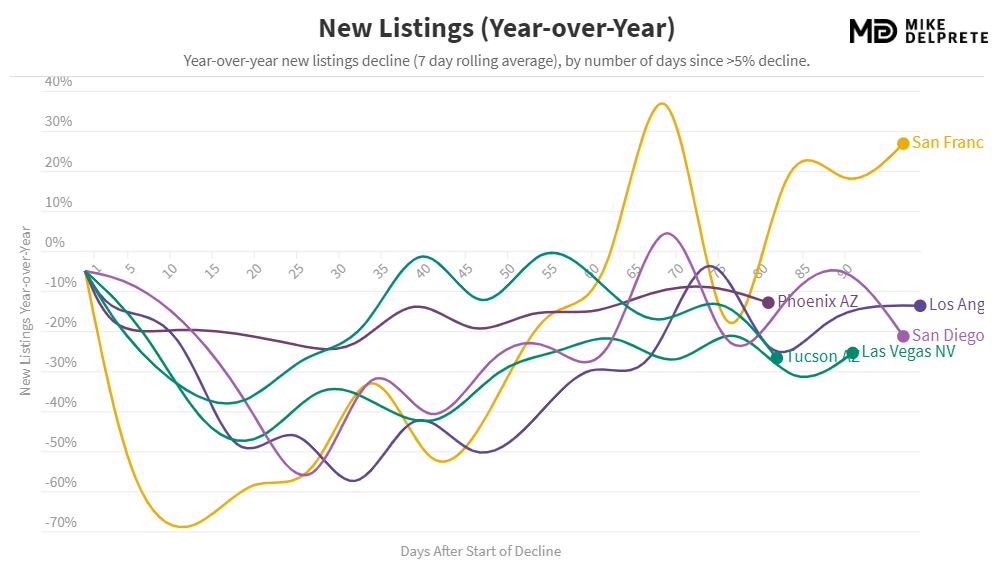
The New Listings graph (above) shows how the raw number of homes listed for sale in the coronavirus era compares to the same time frame in 2019.
It shows that 40-50 days after the initial shock, sellers started feeling more comfortable putting their home on the market, and for the last twenty days, San Diego has only been 5% to 21% behind last year.
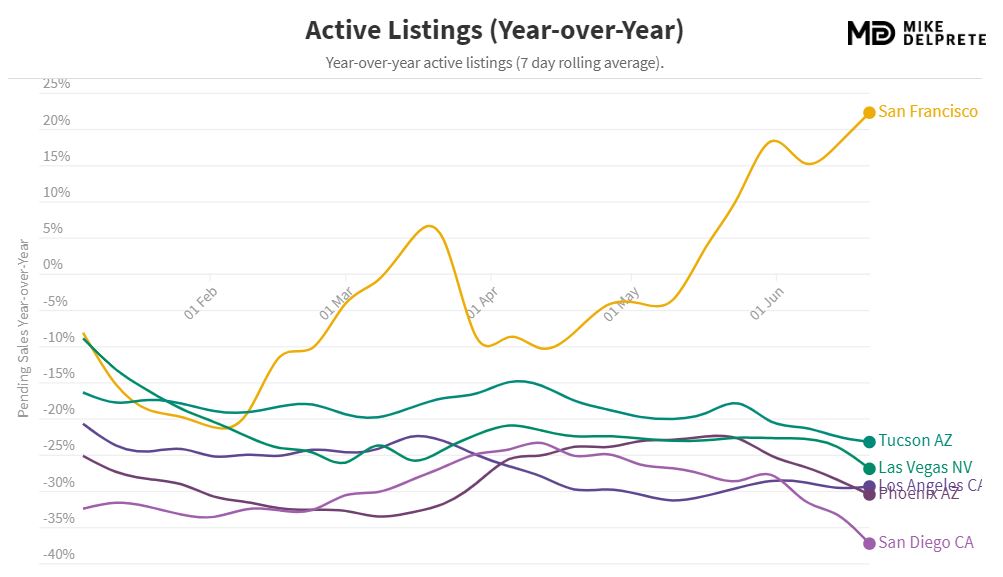
The graph below helps to demonstrate the supply vs. demand relationship year-over-year, and it’s helpful to call these Unsold Listings because they are the net outcome (Supply – Demand = Unsold Listings).
If we were running at the same pace as in 2019, and the demand percentage had dropped the same as supply, then our Unsold Listings would simply be the same 5% to 21% lower than last year. But our number of Unsold Listings are now 37% below last year – the best in the southwest!
Lower inventory, record-low rates, and the insanity are causing demand to surge!
Thanks Mike!
by Jim the Realtor | May 25, 2020 | Actives/Pendings, Inventory, Jim's Take on the Market, Virus |
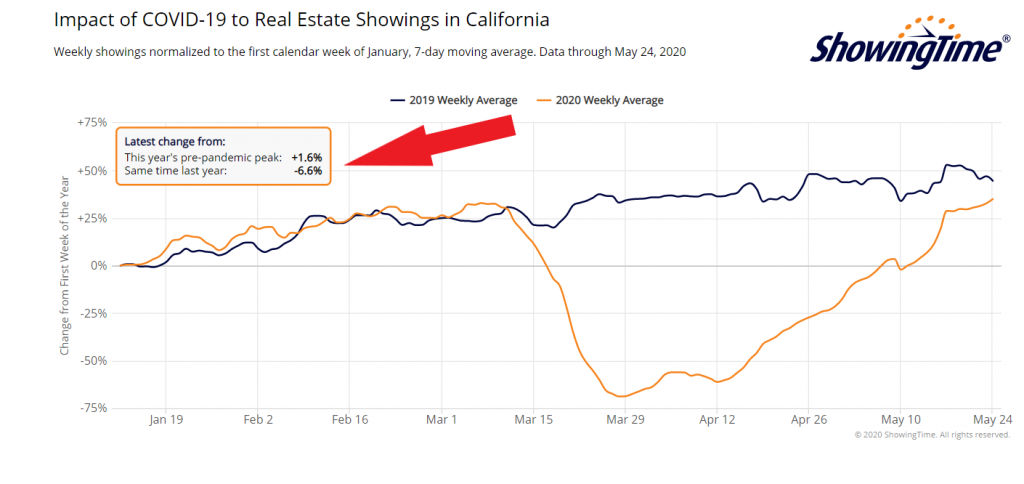
We are back to having a similar number of California showings as we had in the first week of March!
It looks like we will jam the usual six-month-long selling season into just four – May through August – but only if there is enough to sell. The showings leveled off recently, and it might be because buyers have seen everything there is to see. But the total number of new actives did surge higher, but that might only mean you have 1-2 more to look at:
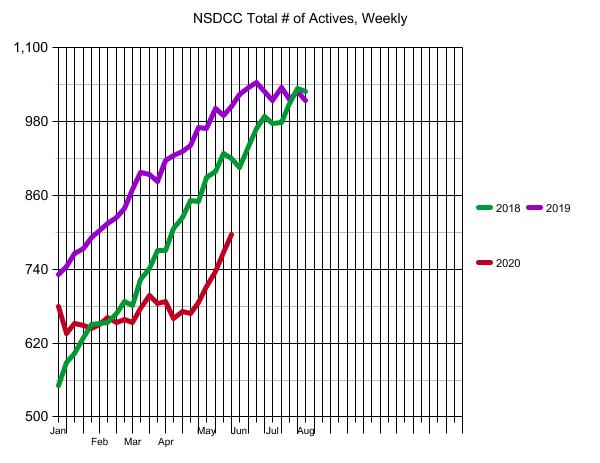
The 121 new listings this week is the most since we had 122 on March 11, 2019 – yet we’re still 200+ listings behind where we were a year ago. The new pendings had a big week too with an increase of 57% over last week’s count:
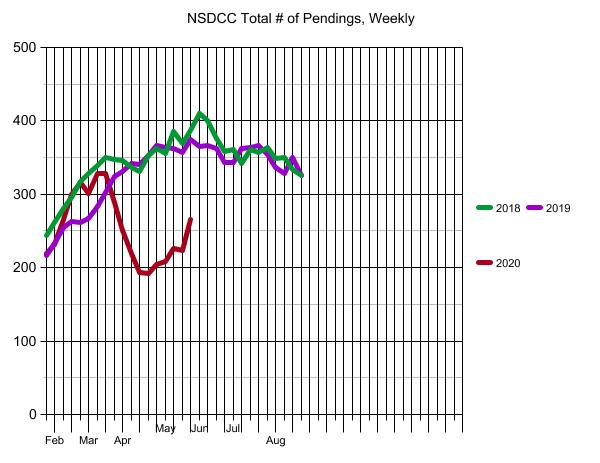
Mortgage rates hit their all-time low this week, so it’s all blue sky ahead!
Weekly NSDCC New Listings and New Pendings
| Week |
New Listings |
New Pendings |
Total Pendings |
| Mar 16 |
83 |
55 |
329 |
| Mar 23 |
59 |
31 |
289 |
| Mar 30 |
63 |
31 |
251 |
| Apr 6 |
57 |
21 |
219 |
| Apr 13 |
48 |
17 |
194 |
| Apr 20 |
63 |
29 |
192 |
| Apr 27 |
79 |
40 |
205 |
| May 4 |
86 |
40 |
208 |
| May 11 |
91 |
48 |
226 |
| May 18 |
95 |
44 |
224 |
| May 25 |
121 |
69 |
266 |
Statistically, we are cranking!
(more…)
by Jim the Realtor | May 14, 2020 | Actives/Pendings, Jim's Take on the Market, North County Coastal, NSDCC Pendings, Psycho-babble, Realtor Training, Thinking of Buying?, Thinking of Selling?, Virus |
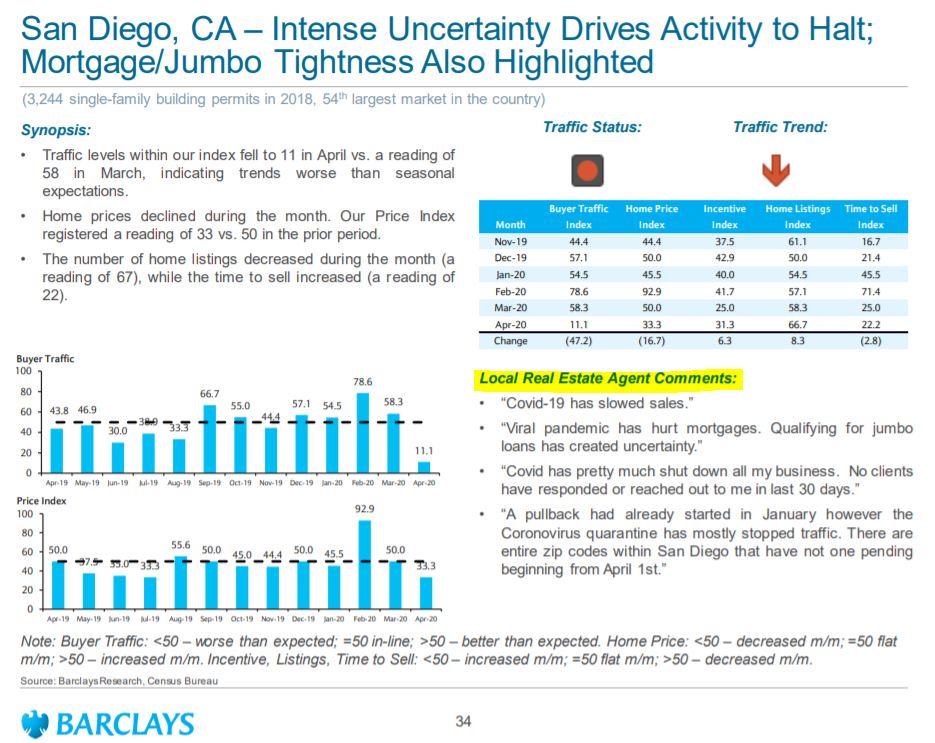
They send out this survey twice each month – on the 15th and 21st – so these agent comments above were based on their market observations around then. Hopefully they have gotten back to work by now:
| Town |
Zip Code |
New Listings Since April 1st |
New Pendings Since April 1st |
| Cardiff |
92007 |
18 |
3 |
| Cbad NW |
92008 |
25 |
15 |
| Cbad SE |
92009 |
63 |
36 |
| Cbad NE |
92010 |
18 |
15 |
| Carlsbad SW |
92011 |
47 |
20 |
| Carmel Vly |
92130 |
79 |
50 |
| Del Mar |
92014 |
28 |
10 |
| Encinitas |
92024 |
71 |
38 |
| La Jolla |
92037 |
60 |
16 |
| RSF |
92067 |
38 |
15 |
| Solana Bch |
92075 |
13 |
2 |
| NSDCC |
Totals |
460 |
220 |
We have had 220 new pendings since April 1st, which is remarkable! The 220 is today’s number, of which 47 have already closed. Others that went pending and fell out of escrow are not included.
by Jim the Realtor | Mar 11, 2020 | Actives/Pendings, Jim's Take on the Market, Market Buzz, Market Conditions, North County Coastal, Virus |

Everyone is wondering how the coronavirus will affect housing, so Bloomberg News decided to whip up the hysteria with this article built on speculation and guesses. Mark Zandi has had one of the most negative opinions about housing, hoping that some day he might be right, and Yunnie has never left his ivory tower.
These are the only facts mentioned in the article:
The potential economic fallout still hadn’t completely registered this past weekend for homebuyers in Seattle, an epicenter of the U.S. outbreak. On Saturday, around four dozen groups filed through a four-bedroom Tudor in the Whittier neighborhood listed for just over $1 million. Many said they had hoped the virus would keep other would-be buyers away in a market where there’s little inventory and bidding wars are frequent.
At another open house nearby, handshakes were out, but plenty of home shoppers came for a look. Craig Rothlin, 34, and Kanako Nakarai, 31, were among them. Both work for tech companies, and have been hurt by the recent stock market rout.
“A good chunk of our down payment is caught up in that,” Rothlin said.
The couple had been waiting to see prices come down. But, so far, that hasn’t happened. The last home they bid on got multiple offers and sold for $180,000 over the asking price.
Seattle is an epicenter of the U.S. outbreak, and FOUR DOZEN GROUPS are looking at an open house? Many said they hoped that the virus would keep other would-be buyers away? There’s your takeaway!
Let’s focus on the facts.
In the area between La Jolla and Carlsbad, there are 121 houses for sale priced under $1,500,000, and 158 pending listings. When there are more pendings than actives, it means the demand is outstripping the supply! Even if some nervous nellies decided to wait it out, there will still be plenty who want to buy a home when rates are at all-time lows.
What about the high-end, Jim, aren’t the affluent more susceptible to stock market swings? Maybe, but they’re not going to give it away! This scare will be over in less than a year, and rich people have a long history of waiting on price, rather than dumping.
What if we have a recession? Then don’t make your payments – banks don’t mind!
It would take a flood of inventory to disrupt the market in a bad way. But the COVID-19 is causing a hunker-down-and-do-nothing environment. Homeowners aren’t going to panic and uproot their life just because of some stinking virus that will pass in 6-12 months.
by Jim the Realtor | Feb 27, 2020 | Actives/Pendings, Jim's Take on the Market, Market Conditions, Spring Kick |
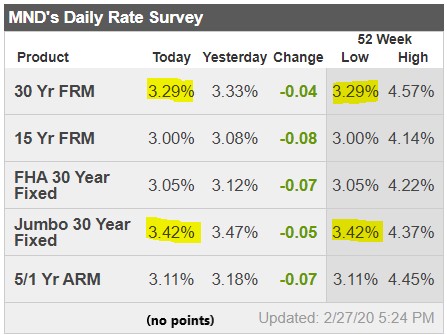
Rates are really low, and the market is responding. We’ve considered it a balanced market when the active listings are running about twice the number of pendings. Here’s how we’re doing so far in 2020, and compared to last February:
NSDCC Detached-Home Active and Pending Listings:
| Area |
Zip Code |
Actives |
Pendings |
A/P Ratio |
Ratio in Feb 2019 |
| Cardiff |
92007 |
14 |
9 |
1.6 |
2.3 |
| Carlsbad NW |
92008 |
29 |
19 |
1.5 |
1.8 |
| Carlsbad SE |
92009 |
48 |
50 |
0.96 |
1.9 |
| Carlsbad NE |
92010 |
12 |
12 |
1.0 |
1.4 |
| Carlsbad SW |
92011 |
21 |
19 |
1.1 |
1.4 |
| Del Mar |
92014 |
48 |
17 |
2.8 |
7.1 |
| Encinitas |
92024 |
65 |
53 |
1.2 |
2.1 |
| La Jolla |
92037 |
153 |
37 |
4.1 |
6.3 |
| RSF |
92067 |
158 |
24 |
6.6 |
10.5 |
| Solana Bch |
92075 |
18 |
12 |
1.5 |
7.7 |
| Carmel Vly |
92130 |
42 |
50 |
0.8 |
2.4 |
| All Above |
All |
618 |
302 |
2.0 |
3.3 |
We are at the 2.0 mark, but take out La Jolla and Rancho Santa Fe and we’re at 1.3!
In SE Carlsbad and Carmel Valley – which are about the same size – we have more pendings than actives!
by Jim the Realtor | Jul 18, 2019 | Actives/Pendings, Jim's Take on the Market, North County Coastal |

The selling season is pretty much over – did you get ‘er done? Or did summer slip away from you?
School starts in 40 days…..there is still time!
But when you include a couple of days for negotiating, and a couple of days for moving, you need to make a deal by Monday!
Lower rates have helped to keep our pending sales afloat, so don’t give up hope:
Get Good Help!
by Jim the Realtor | May 30, 2019 | Actives/Pendings, Graphs of Market Indicators, Jim's Take on the Market, Market Conditions
The numbers are going to bounce around, so can we agree on two things?
A. Variances of 1%-3% are natural.
B. National stats don’t mean anything to you and me.
Let’s keep it local! Here are the San Diego North Coastal 3-month-moving averages on pendings:
Two big YoY increases and a minor decrease look ok to me.
by Jim the Realtor | May 23, 2019 | Actives/Pendings, Jim's Take on the Market, Market Conditions, North County Coastal |
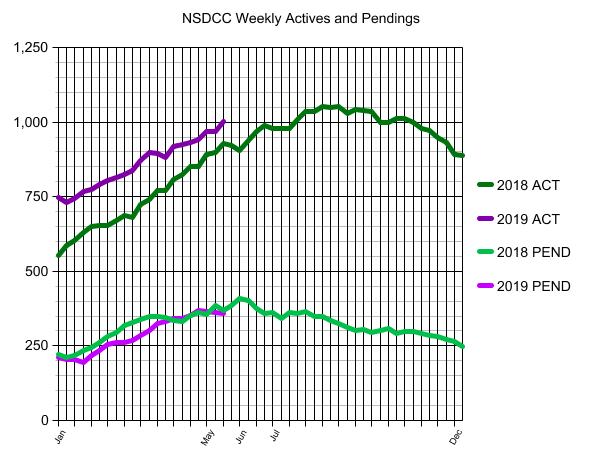
Here’s a visual comparison of last year’s counts of NSDCC weekly active and pending listings, and how we are doing this year.
Mortgage rates had bumped up from 4.47% in April to 4.83% in October, but the inventory kept growing too, which didn’t help. The pendings are a better gauge than sales for showing when the buying decisions were being made, and you can see that last year, buyers started losing interest after mid-June.
The bulging inventory in the second half of 2018 also left us with an inventory hangover. We started the year with 35% more homes on the market than the previous year, which led to a slower start in 2019.
But the weekly pendings have strengthened lately, and have been tracking about the same counts as we had in 2018 – probably due to lower rates. Last month, the Freddie Mac average 30-year rate was 4.14%.
If rates stay the same as they are today, we really should see the season extend past June – because it got whacked last year. But high pricing and more inventory could spoil the momentum too.
by Jim the Realtor | Mar 25, 2019 | Actives/Pendings, Inventory, Jim's Take on the Market |

How’s the market?
The surge continued this past week, with the current pendings count rising from 302 to 324, which is a 7% increase. Last year, the pendings topped off the previous week and then dropped for four weeks. With this current burst, the pendings count is only seven percent behind last year.
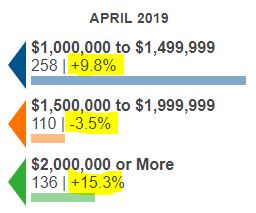
The battle lines are drawn right around the $2 million mark, with the number of actives priced over $2,000,000 being 19% higher than in early January.
But the Under-$2,000,000 market looks great:
NSDCC Actives and Pendings
| List Price Range |
Actives |
Pendings |
Actives/Pendings Ratio |
| $2,000,000- |
415 |
235 |
1.8 |
| $2,000,000+ |
474 |
95 |
5.0 |
There probably isn’t much trickle up? But the 5.0 isn’t bad, and the 95 pendings is a 53% increase from a month ago!
~~~~~~~~~~~~~~~~~~~~~~~~~~~~~~~~~~~~~~~~~~~~~~~~~~
(more…)
by Jim the Realtor | Mar 11, 2019 | Actives/Pendings, Bidding Wars, Inventory, Jim's Take on the Market

The surge noted last week continued its hot streak, which should be expected as the selling season really gets rolling. The total number of pendings increased 6%, and those over $2,000,000 increased 24%!
Glad to see the $2,000,000+ market having some life, with 462 active listings – or 54% of the total inventory of houses for sale between La Jolla and Carlsbad.
~~~~~~~~~~~~~~~~~~~~~~~~~~~~~~~~~~~~~~~~~~~~~~~~~~
Even though it might feel warmer, we are still lagging behind last year:
Weekly Total Pendings
| Week |
2018 |
2019 |
% diff |
| Jan |
244 |
217 |
-11% |
| Feb |
262 |
233 |
-11% |
| Feb |
280 |
255 |
-9% |
| Feb |
295 |
263 |
-11% |
| Feb |
318 |
261 |
-18% |
| Mar |
328 |
267 |
-19% |
| Mar |
339 |
284 |
-16% |
What might contribute to buyers wanting to wait-and-see a bit longer is the lack of bidding wars. Instead of having to deal with the messy multiple-offer situations, agents who get a hot listing just sell it off-market now.
Without bidding wars, we don’t have those disappointed losers who get more determined to grab the next one, and move quickly to pay whatever it takes.
(more…)