by Jim the Realtor | Dec 7, 2021 | 2021, Frenzy, Frenzy Monitor |
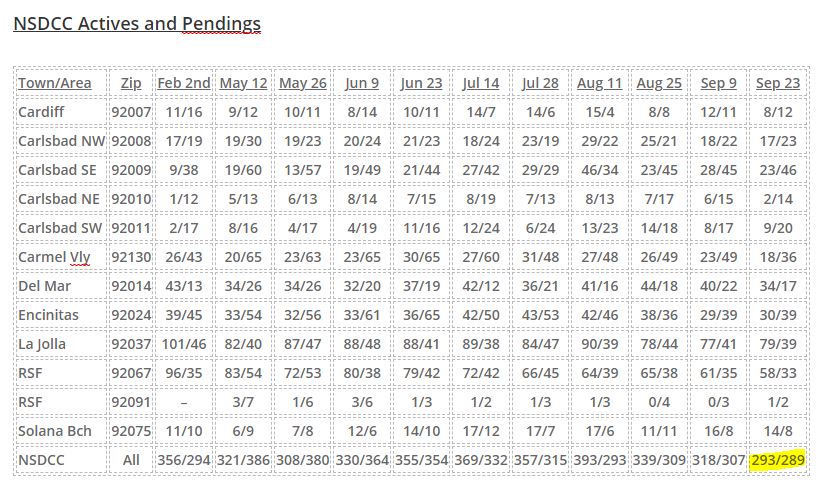
The reason for breaking down the active and pending listings by zip code is to give the readers a closer look at their neighborhood stats.
Our Big Three zip codes – where you can still buy a decent house for $2,000,000 – are still having more pendings than actives (highlighted below), but let’s note how strong the pending counts are in La Jolla and Rancho Santa Fe too:
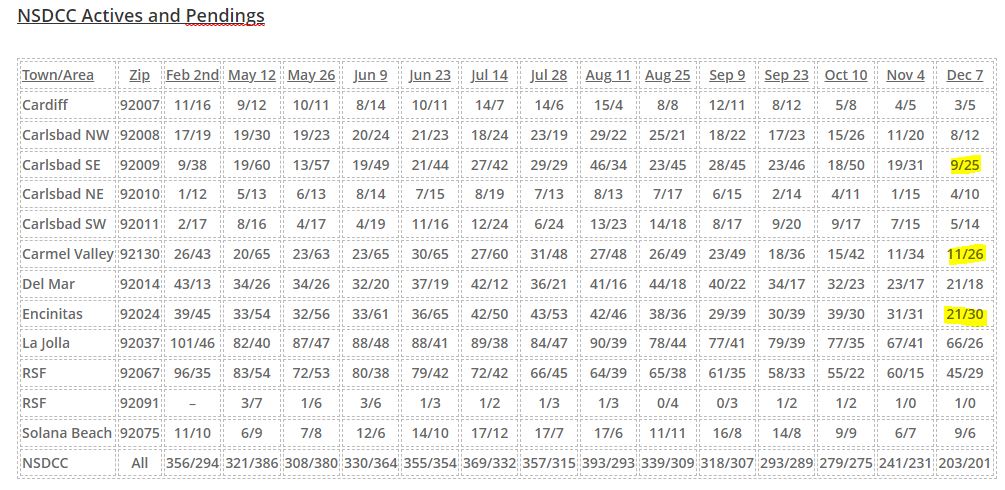
The median list price in La Jolla today is $5,422,500, and in RSF it is $7,700,000!
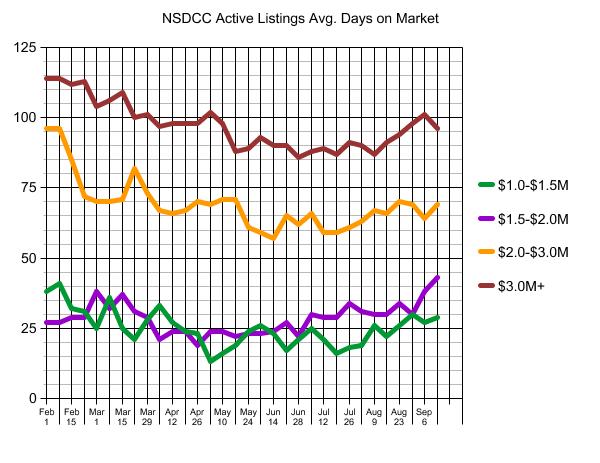
We can also track the average market times too. Upward trends here would indicate market slowing:
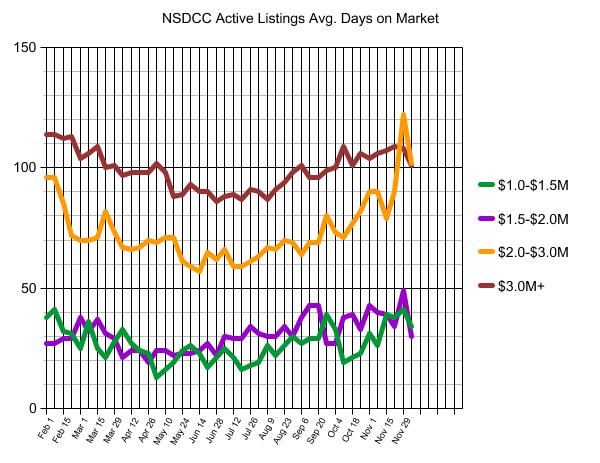
All four categories have improved recently, and the high-end $3,000,000+ average market times have been in the tightest range over the last few months!
Some may call this the off-season, but the only reason that the numbers aren’t any better is because the number of new listings is so low. Brace for impact in 2022!
by Jim the Realtor | Dec 6, 2021 | 2021, Frenzy, Inventory |
Virtually all of the ivory-tower crowd thinks that pricing will settle down in 2022.
They should take a good look at how 2021 is wrapping up.
Admittedly, the San Diego market is at the extreme end, with our inventory enduring the biggest YoY dropoff anywhere in the country. It’s been that way around here for months, and the NSDCC stats for November show how explosive the pricing can be when buyers are starved for quality homes for sale:
| Year |
NSDCC November Sales |
Median LP/sf |
Median SP/sf |
LP:SP |
| 2019 |
212 |
$1,391,500 |
$1,347,500 |
97% |
| 2020 |
306 |
$1,597,000 |
$1,589,950 |
100% |
| 2021 |
195 |
$2,000,000 |
$2,100,000 |
105% |
The median sales price is 32% higher than it was 12 months ago, and 56% higher than it was two years ago!
We thought that the last half of 2020 was the frenzy of all-time, mostly because there was ample inventory that enabled home buyers to set monthly sales records.
But the second half of 2021 has been experiencing a radical pricing frenzy, with the November LP:SP ratio at a whopping 105%! The median sales price is $100,000 higher than the median list price? Wow!
~~~~~~~~~~~~~~~~~~~~~~~~~~~~~~~~~~~~~~~~~~~~~~~
(more…)
by Jim the Realtor | Nov 30, 2021 | 2021, Frenzy, Same-House Sales |
‘Deceleration’ at +24.9% YoY compared to when our market was just ramping up for the year-end frenzy of 2020? I’ll take it!
San Diego Non-Seasonally-Adjusted CSI changes
| Observation Month |
SD CSI |
M-o-M chg |
Y-o-Y chg |
| Jan ’20 |
264.04 |
+0.2% |
+5.1% |
| Feb |
265.34 |
+0.5% |
+4.6% |
| Mar |
269.63 |
+1.6% |
+5.2% |
| Apr |
272.48 |
+1.1% |
+5.8% |
| May |
273.51 |
+0.4% |
+5.2% |
| Jun |
274.91 |
+0.5% |
+5.0% |
| Jul |
278.00 |
+1.1% |
+5.4% |
| Aug |
283.06 |
+1.8% |
+7.6% |
| Sep |
288.11 |
+1.8% |
+9.4% |
| Oct |
292.85 |
+1.6% |
+11.5% |
| Nov |
295.64 |
+1.0% |
+12.3% |
| Dec |
297.52 |
+0.6% |
+13.0% |
| Jan ’21 |
301.72 |
+1.4% |
+14.3% |
| Feb |
310.62 |
+2.9% |
+17.1% |
| Mar |
320.81 |
+3.3% |
+19.1% |
| Apr |
331.47 |
+3.3% |
+21.6% |
| May |
341.05 |
+2.9% |
+24.7% |
| Jun |
349.78 |
+2.6% |
+27.2% |
| Jul |
355.33 |
+1.6% |
+27.8% |
| Aug |
357.11 |
+0.5% |
+26.2% |
| Sep |
359.88 |
+0.8% |
+24.9% |
“If I had to choose only one word to describe September 2021?s housing price data, the word would be ‘deceleration,’ says Craig Lazzara, managing director at S&P Dow Jones Indices. “Housing prices continued to show remarkable strength in September, though the pace of price increases declined slightly.”
Extremely tight inventory, as well as heavy investor activity in the housing market, is keeping prices elevated. While the gains are falling, it is unlikely that prices will drop dramatically as they did during the housing crash. The fundamentals of supply and demand still favor an expensive market.
“The market has cooled since the beginning of the year, when dozens of competing bids, contingency waivers and price escalation clauses made home shopping a struggle, especially for first-time buyers. A growing number of homeowners are preparing to list in the next six months, hinting at an uncharacteristically active winter season,” said George Ratiu, manager of economic research at Realtor.com.
by Jim the Realtor | Nov 17, 2021 | 2021, Frenzy, Jim's Take on the Market, Sales and Price Check |
Can we learn from the past frenzy periods?
We didn’t have the huge price increases in 2001-2002 mostly because there was plenty of inventory to go around. It was more of a sales frenzy, which finally started to slow in 2004 as prices exploded.
I left out the 2007-2011 era:
The inventory dipped to an unprecedented low level in 2021, causing buyers to scramble for those homes that were for sale. We’ve had the most sales since the last frenzy of 2013, and will probably end the year with a total number of sales in the Top Five of All-Time.
Fewer listings make the pursuit more challenging, but this frenzy will continue until prices get high enough to cause sales to slow down. Keep an eye on the number of sales – our leading indicator!
by Jim the Realtor | Nov 12, 2021 | 2021, Frenzy, Over List
The insanity is finding a comfortable range…..until next spring:
NSDCC Detached-Home Sales, % Closed Over List Price
January: 38%
February: 43%
March: 53%
April: 55%
May: 54%
June: 59%
July: 64%
August: 55%
September: 41%
October: 45%
A slight uptick in the overall percentage, but the high-end buyers aren’t going for this nonsense any more:
Percentage Of Sales Over List Price by Price Range
| Price Range |
March |
April |
May |
June |
July |
Aug |
Sept |
Oct |
| $0 – $1.0M |
76% |
79% |
89% |
88% |
89% |
88% |
64% |
78% |
| $1.0M – $1.5M |
68% |
78% |
84% |
75% |
74% |
74% |
37% |
64% |
| $1.5M – $2.0M |
66% |
66% |
72% |
66% |
82% |
73% |
61% |
58% |
| $2.0M – $3.0M |
54% |
32% |
34% |
66% |
56% |
56% |
36% |
38% |
| $3M+ |
16% |
22% |
22% |
17% |
26% |
19% |
24% |
7% |
October saw new highs in average list and sales prices, which would indicate strong action in the higher-end homes. The medians have been fairly steady:
NSDCC Average and Median Prices
| Month |
# of Sales |
Avg. LP |
Avg. SP |
Median LP |
Median SP |
| Feb |
224 |
$2,298,797 |
$2,257,334 |
$1,719,500 |
$1,758,000 |
| March |
252 |
$2,295,629 |
$2,260,524 |
$1,800,000 |
$1,825,000 |
| April |
357 |
$2,396,667 |
$2,403,962 |
$1,799,900 |
$1,828,000 |
| May |
300 |
$2,596,992 |
$2,581,715 |
$1,900,000 |
$1,994,500 |
| June |
348 |
$2,509,175 |
$2,537,953 |
$1,900,000 |
$1,967,500 |
| July |
311 |
$2,421,326 |
$2,442,738 |
$1,795,000 |
$1,855,000 |
| Aug |
268 |
$2,415,075 |
$2,438,934 |
$1,897,000 |
$1,950,000 |
| Sept |
278 |
$2,479,440 |
$2,445,817 |
$1,899,000 |
$1,987,500 |
| Oct |
248 |
$2,754,470 |
$2,705,071 |
$1,899,000 |
$1,899,500 |
The average sales price increased 30% YoY, and the median sales price is up 13% YoY, but that is also compared to the 382 sales last October – which was, and will always be, the most sales in any October.
As sales taper off over the next 2-3 months, it might cause a little more volatility in these pricing metrics.
~~~~~~~~~~~~~~~~~~~~~~~~~~~~~~~~~~~~~~
by Jim the Realtor | Oct 15, 2021 | 2021, Forecasts, Frenzy, Jim's Take on the Market
People are leery when the squid speaks, but they could be right about additional price gains in 4Q21.
Here’s why:
- We had a 15% increase in the NSDCC median sales price between September, 2020 and January.
- There will be fewer sales this year, which typically provides more volatility.
- Frustrated buyers will pass on the fixers, and wait ’til next year instead.
- With the sales mix having a bigger percentage of superior homes, pricing should get a boost.
My #1 reason? We’ve experienced intense frenzy conditions, and it has gotten to the point where the comps don’t seem to matter any more. Buyers just want a house, and they will pay whatever it takes!
by Jim the Realtor | Oct 13, 2021 | 2021, Frenzy

Rob Dawg suggested that the total volume of the frenzy must be remarkable.
Both sales and pricing are higher, and the higher-end markets have never had it so good.
NSDCC Total Sales Volume, First Three Quarters of the Year
| Year |
# of Sales Under $2M |
Dollar Volume |
# of Sales Over $2M |
Dollar Volume |
| 2017 |
1,938 |
$2,241,780,605 |
459 |
$1,465,970,635 |
| 2018 |
1,712 |
$2,094,987,871 |
464 |
$1,562,253,960 |
| 2019 |
1,686 |
$2,079,217,390 |
478 |
$1,626,984,079 |
| 2020 |
1,661 |
$2,135,713,260 |
554 |
$1,974,229,362 |
| 2021 |
1,403 |
$2,066,211,128 |
1,148 |
$4,102,211,128 |
Remarkable indeed! The affluent have commandeered the market.
by Jim the Realtor | Oct 8, 2021 | 2021, Frenzy, Over List
Here is where the cooling-frenzy shows up.
The number of buyers who are willing to pay over list price is dropping:
NSDCC Detached-Home Sales, % Closed Over List Price
January: 38%
February: 43%
March: 53%
April: 55%
May: 54%
June: 59%
July: 64%
August: 55%
September: 41%
To have 41% of the sales close over list price would be remarkable….if it weren’t for the last six months!
Percentage Who Paid Over List Price by Price Range
| Price Range |
March |
April |
May |
June |
July |
Aug |
Sept |
| $0 – $1.0M |
76% |
79% |
89% |
88% |
89% |
88% |
64% |
| $1.0M – $1.5M |
68% |
78% |
84% |
75% |
74% |
74% |
37% |
| $1.5M – $2.0M |
66% |
66% |
72% |
66% |
82% |
73% |
61% |
| $2.0M – $3.0M |
54% |
32% |
34% |
66% |
56% |
56% |
36% |
| $3M+ |
16% |
22% |
22% |
17% |
26% |
19% |
24% |
The average sales prices have been virtually identical for the last three months, and the median sales price is back up to where it was in May:
NSDCC Average and Median Prices
| Month |
# of Sales |
Avg. LP |
Avg. SP |
Median LP |
Median SP |
| Feb |
224 |
$2,298,797 |
$2,257,334 |
$1,719,500 |
$1,758,000 |
| March |
252 |
$2,295,629 |
$2,260,524 |
$1,800,000 |
$1,825,000 |
| April |
357 |
$2,396,667 |
$2,403,962 |
$1,799,900 |
$1,828,000 |
| May |
300 |
$2,596,992 |
$2,581,715 |
$1,900,000 |
$1,994,500 |
| June |
348 |
$2,509,175 |
$2,537,953 |
$1,900,000 |
$1,967,500 |
| July |
311 |
$2,421,326 |
$2,442,738 |
$1,795,000 |
$1,855,000 |
| Aug |
268 |
$2,415,075 |
$2,438,934 |
$1,897,000 |
$1,950,000 |
| Sept |
278 |
$2,479,440 |
$2,445,817 |
$1,899,000 |
$1,987,500 |
Compared to last September, the average sales price was +25%, and the median sales price was +33%!
Sales should taper off the rest of the year, but not sure if pricing will follow!
~~~~~~~~~~~~~~~~~~~~~~~~~~~~~~~~~~~~~~
by Jim the Realtor | Oct 1, 2021 | 2021, Frenzy, Jim's Take on the Market, Sales and Price Check

The 3/4 Report!
NSDCC Detached-Home Listings and Sales between Jan 1st and September 30
| Year |
# of Listings |
# of Sales |
Median Sales Price |
# of Sales Over $2,000,000 |
| 2017 |
3,888 |
2,385 |
$1,230,000 |
459 |
| 2018 |
3,977 |
2,166 |
$1,320,000 |
464 |
| 2019 |
3,947 |
2,148 |
$1,320,000 |
478 |
| 2020 |
3,677 |
2,207 |
$1,424,000 |
554 |
| 2021 |
3,072 |
2,519 |
$1,880,000 |
1,140 |
We usually have roughly 3,900 listings in the first three quarters of each year, until covid hit. This year, there were 21% fewer listings, yet sales have soared – up 14% above 2020 sales.
The median sales price is up 32% YoY, and the sales over $2,000,000 have MORE THAN DOUBLED last year’s previous record count!
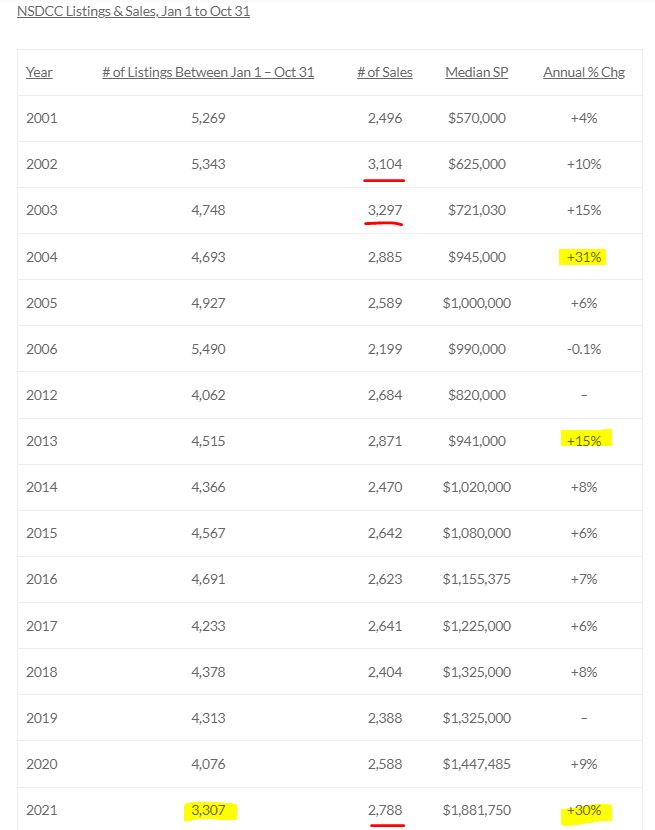
by Jim the Realtor | Sep 23, 2021 | 2021, Actives/Pendings, Frenzy, Frenzy Monitor
The reason for breaking down the active and pending listings by zip code is to give the readers a closer look at their neighborhood stats.
It’s interesting to see that the total number of actives and pendings are so similar – as close as they were in late-June as the max frenzy was unwinding. The big split in the counts on August 11th made it look like the frenzy was coming apart, but they’ve gotten back in line nicely since:
But with fewer homes for sale combined with the time of year, we probably won’t see much change. Let’s call it low-grade frenzy conditions for now.
The average days on market is creeping upward, but still no big concerns. There will always be sellers who would rather wait for the lucky sale, than adjust their price – and longer average market times indicate more sellers doing the former. Though we should note that the hottest range ($1.5 – $2.0) must have a lot of dogs lying around:
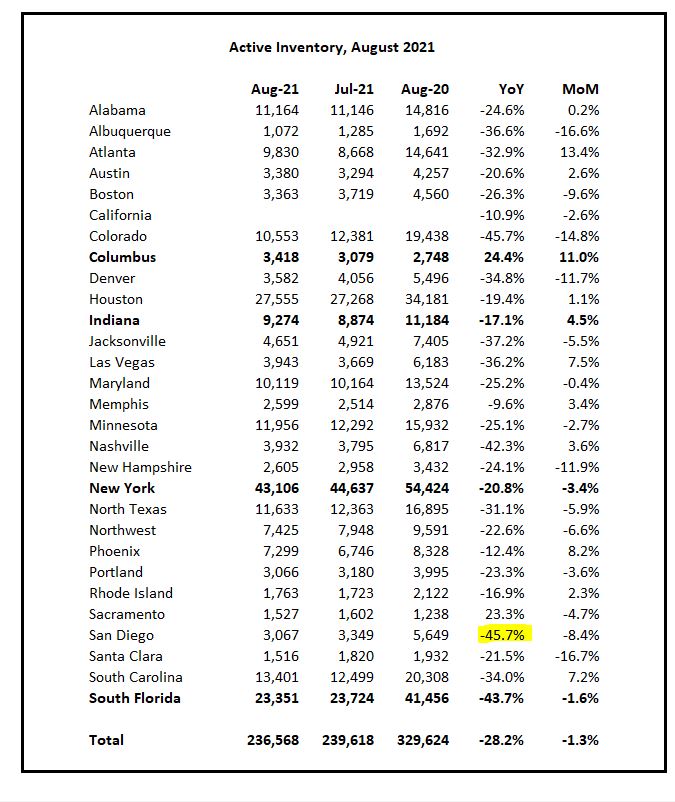
San Diego County has experienced the worst YoY change of active listings IN THE NATION. Three thousand houses for sale in a county of 3.3 million people? Yikes!!
And that was the August report. Today in San Diego County:
ACTIVES: 1,760
PENDINGS: 2,600
Wow!


