by Jim the Realtor | Sep 26, 2022 | Market Conditions
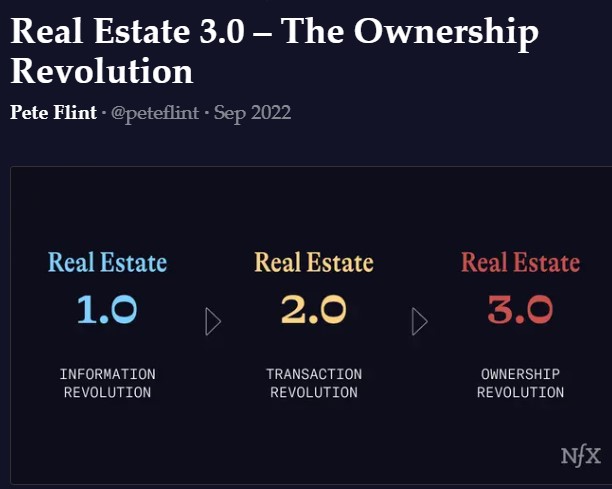
Pete has been trying to disrupt the real-estate-selling business for years, but here it seems like he is giving up on replacing realtors and is acknowledging the American tradition:
This type of “classic” residential home ownership is likely not dying. 65% of families in the US are home owners. There’s a reason this number has stayed within a remarkably narrow range of +/- 4% from an average of 65% over almost 60 years. A home is still seen as financial stability, security, safety net. Despite exciting rises in nomadic living fueled by the pandemic, when it comes to schools and families and establishing community, being in one place and owning is going to continue to be important for most Americans. Certainly not all, but most.
But he’s still optimistic that disrupters can manufacture ways to get a piece of the pie. Read full article here:
https://www.nfx.com/post/real-estate-3-proptech-the-ownership-revolution
by Jim the Realtor | Sep 26, 2022 | Inventory
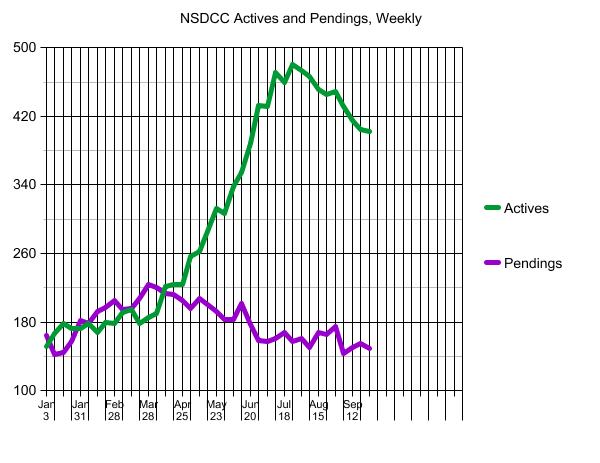
The NSDCC September sales are right at 100 with a week to go (last year’s count was 283), so this month’s final count should get up to about half of last year’s. Those hoping for a crushing decline in coastal pricing have to be disappointed so far:
By this time next week, we will be into 4Q22, and the holiday season closing in. The next couple of weeks should be active, and be the best shot at buying and selling over the next 3-4 months.

~~~~~~~~~~~~~~~~~~~~~~~~~~~~~~~~~~~
(more…)
by Jim the Realtor | Sep 25, 2022 | Jim's Take on the Market, Mortgage News, Mortgage Qualifying |
Thanks to JBREC for the chart, and article!
https://www.realestateconsulting.com/speedy-escape-from-housing-market-slump-unlikely/
An excerpt:
In the mid-1990s when 30-year fixed mortgage rates climbed over 9%, ARM usage jumped to 35% of all mortgages. In 1999-2000 as 30-year fixed mortgage rates shot above 8%, ARM usage raged once again to 34% of all mortgages. For comparison, the percentage of homebuyers using ARMs today is just 9%, even as housing affordability resides near its all-time worst and 30-year fixed-rate mortgages have more than doubled in the span of 19 months. As noted by the CEO of KB Home during its Q3-2022 earnings call September 21st: “We have some great and compelling interest rates on adjustable mortgages, where it’s a 10-year fixed. And if I were a buyer, I would take that in a minute. Those [rates] are couple of hundred basis points lower than the 30-year fixed, and nobody is taking it so far.”
Back in the day, ARM usage around here was probably more like 2/3s of the loans, instead of 1/3 of mortgages nationally. Rarely did anyone think they were buying their ‘forever’ home, and moving again within 2-5 years was the plan. I used to just go back to my past clients every two years!
It when I coined my all-time favorite slogan, “Don’t unpack, I’ll be back!”
I predict that over the next 3-6 months, the mortgage industry will be heavily advertising alternative loans like the short-term (5-year and 7-year) fixed rate, or the 2/1 buydowns. These were the products that kept the party going after the new 2-out-of-5-year law was passed in 1997, and serial movers could cash out tax-free every couple of years and buy a better home.
It was later, around 2004-2005, that Countrywide developed their toxic version of the neg-am loan, and then was offering 100% financing to anyone with a 700 credit score that the bubble started popping.
I think we are all convinced that the Fed is going to deliberately cause a recession in the next 1-2 years, and will have to lower rates again – and continue their biggest boondoggle in history. Anyone who buys with an adjustable-rate mortgage can refinance to a lower 30-year fixed rate then.
Wouldn’t it be great if the mortgage industry brought back the convertible loan where you could change your ARM into a fixed rate without having to refinance!
The key to igniting the demand will be a 3-handle, and it’s already in some ads:
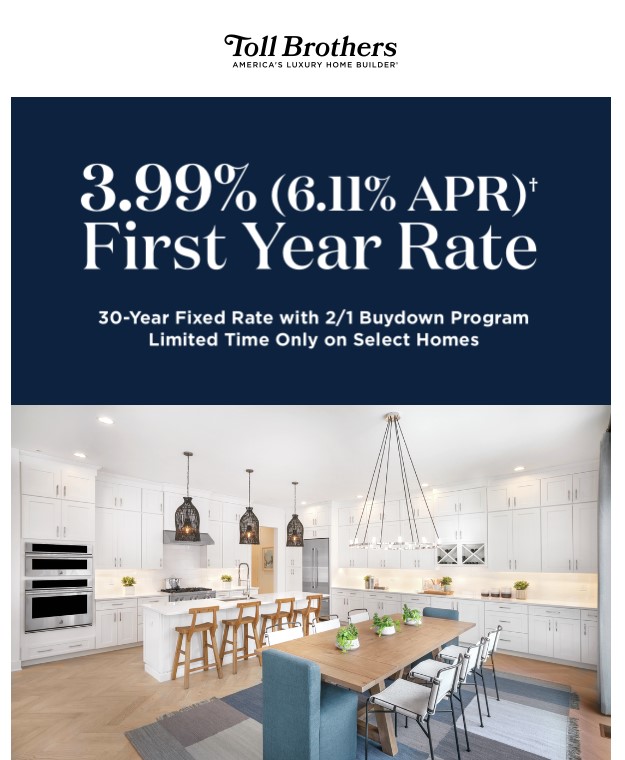
Some listing agents are offering a seller credit to buy down the mortgage rate, but it’s vague and uncertain. Will it be enough to make a real difference? Do I have to go through your lender to get it?
I think the mortgage industry needs to advertise the specific rates and terms to gain acceptance in the marketplace. Buyers have only been thinking about getting a 30-year fixed, and will be slow to consider an ARM. But it might be the best hope of a softer landing.
by Jim the Realtor | Sep 24, 2022 | About the author, Bubbleinfo Readers, Jim's Take on the Market |
This blog started on September 24, 2005. It was a Saturday morning, and literally I thought I better get into this blogging thing before every other realtor started doing it. This was my first blog post that talked about 20% to 25% appreciation per year:
https://www.bubbleinfo.com/2005/09/24/20-25-appreciation-per-year-how-can-that-happen/
I am very grateful for you being here. At the height of the notoriety in 2009-2010 when all we talked about was foreclosures and short-sales, the monthly unique users was around 11,000. To still have 6,421 over the last 30 days is fantastic, given that the market turned 180 degrees in the opposite direction since 2009, and I figure that once readers buy or sell a house, they are likely to quit reading and go on with their life:
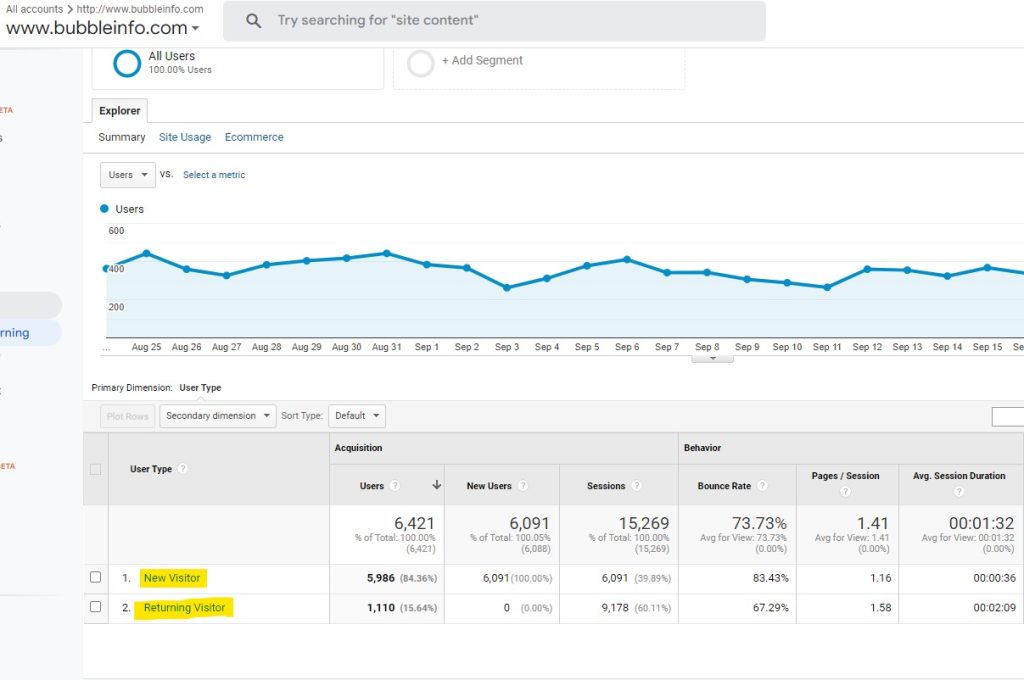
The new-visitor count has to be loaded with bots.
Where are you from?
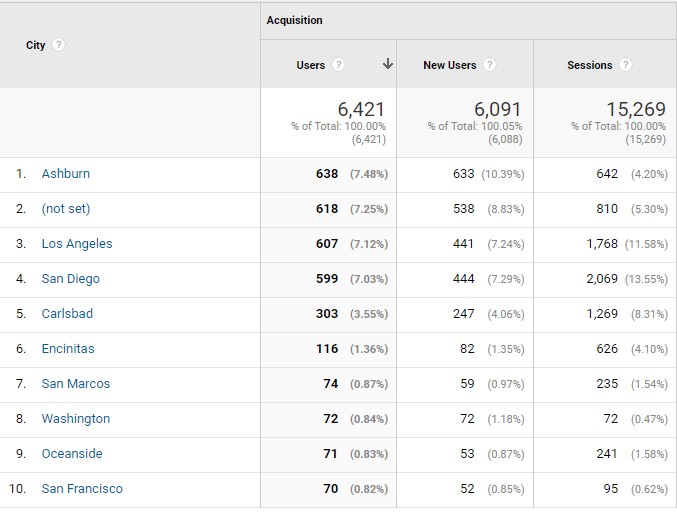
Ashburn must be where the bots live?
What devices are you using?
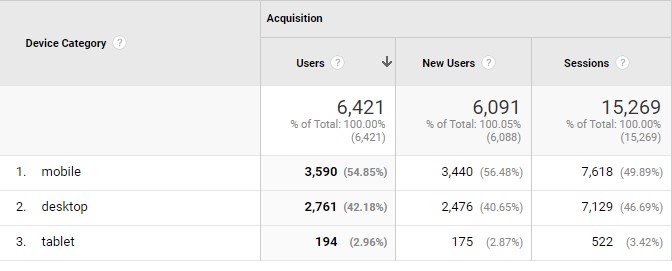
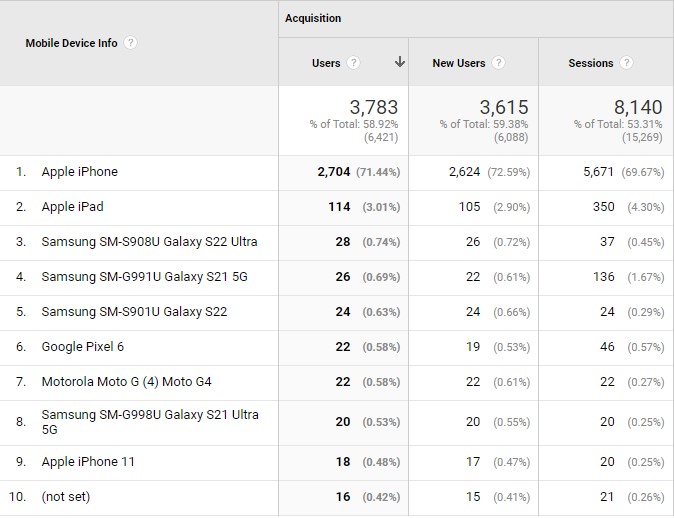
Do bots have a mobile device?
Beats me, but if they don’t, then the audience of real people is into the thousands – yay!
How about age and gender?
I love seeing the younger people – about one-third of you are age 34 and under:
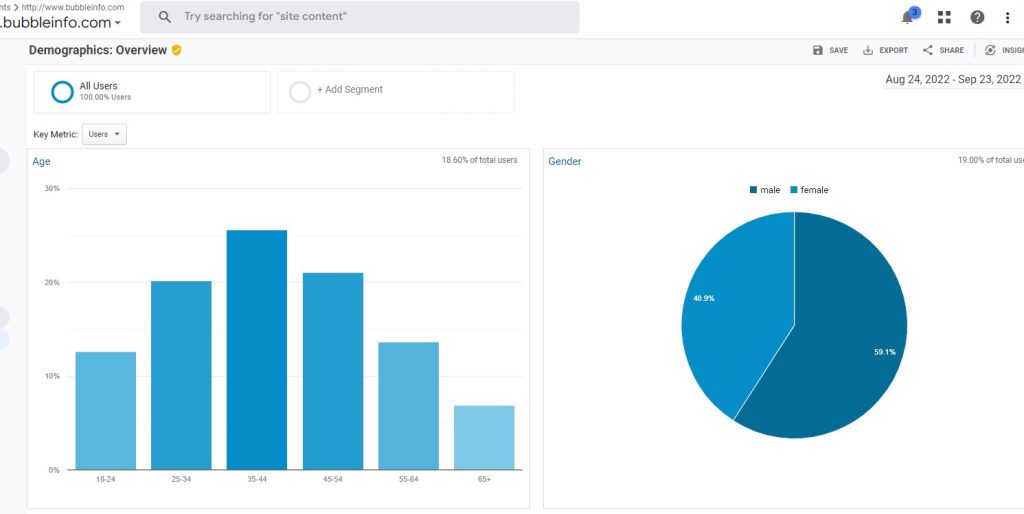
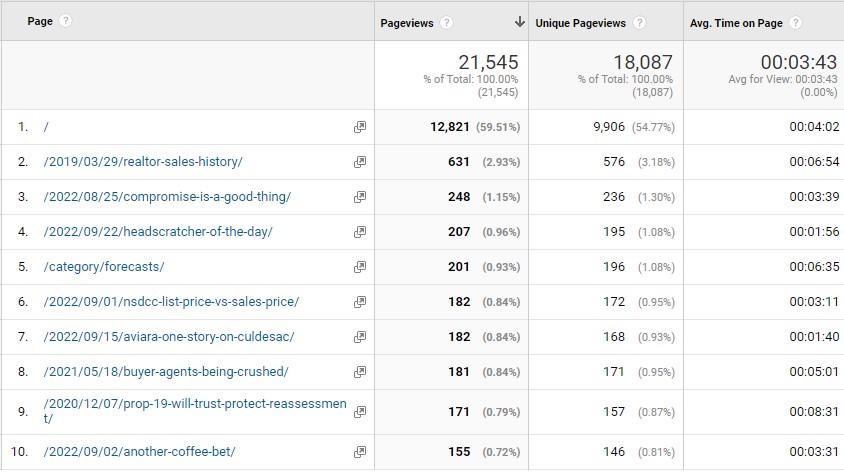
About 60% of readers go straight to the home page, and the others are either searching for a specific real estate topic and find a bubbleinfo article, or readers are sharing links to articles with their friends and family, which I really appreciate – thank you:
Thank you for being here!
by Jim the Realtor | Sep 23, 2022 | Where to Move
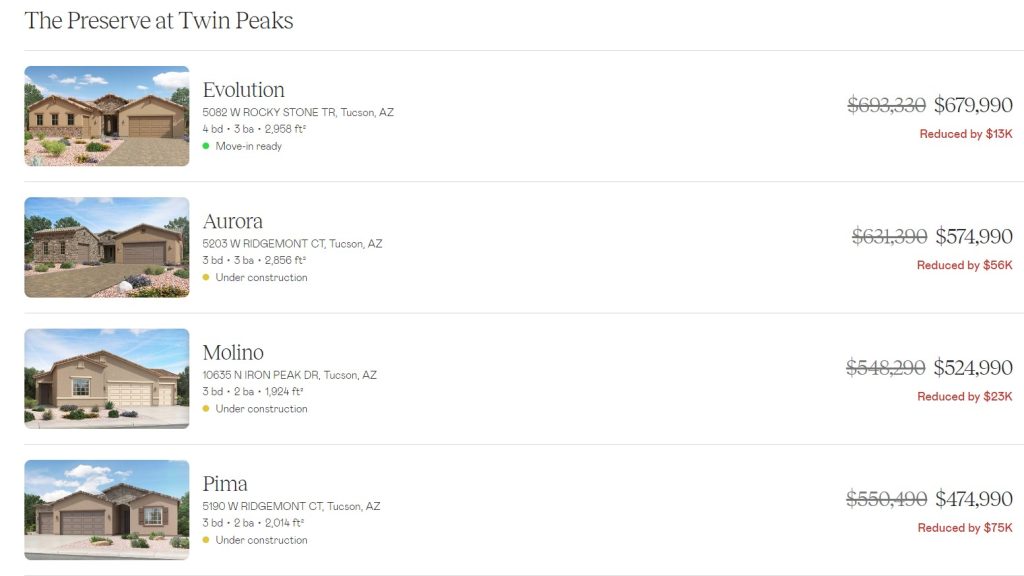
In an effort to help readers find a replacement home, here are new homes near Tucson for sale! This development is out in the sticks but at least it’s on the north side and on the way to Phoenix.
They have several homes available, and they start as low as $307,900:
https://www.lennar.com/new-homes/arizona/tucson/promo/tuclen_qmi_year_end_sales_event

by Jim the Realtor | Sep 23, 2022 | Jim's Take on the Market, Market Buzz, Market Conditions |
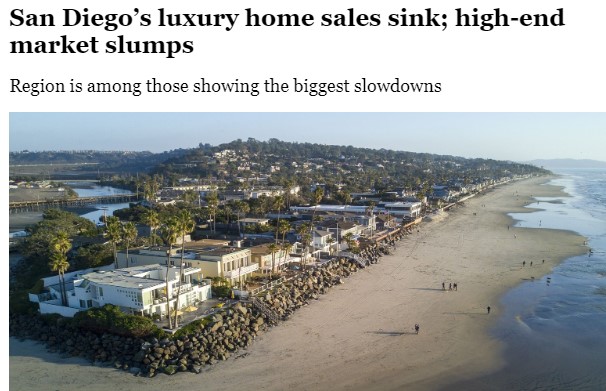
Here we go again with the click bait on the front page of the local birdcage liner. They also used a photo of the most prime real estate in the county, insinuating that a slump is underway there?
Link here for the full article, and this is an excerpt:
San Diego luxury home sales are down by more than half as the high-end market sees its biggest drop in at least a decade. Out of the 50 most-populated metro areas, San Diego had the fourth-highest drop in luxury sales from June to August, said a report from Redfin released Thursday. The number of sales was down 55.3 percent from the same time last year.
The markets with the biggest drops were Oakland (down 63.9 percent), San Jose (down 59.6 percent) and Miami (down 55.5 percent). The lowest drops were in Kansas City (down 10.4 percent) and Indianapolis (down 7.5 percent).
Redfin defined luxury housing as the top 5 percent of the highest-priced homes for sale. So, what is considered luxury differed greatly across metro areas. For example, the median price of a luxury home in Cleveland was $629,000, compared to $3.3 million in San Diego metro (which includes all of San Diego County).
Rising mortgage rates are cited as the main reason for the entire housing market slowing down. Redfin also said economic uncertainty and a tepid stock market also were dampening sales.
Sales are down by more than half?
High-end market sees its biggest drop in at least a decade?
Maybe the higher-end sales in the rest of the county aren’t as boisterous as they used to be, but sales and pricing between La Jolla and Carlsbad looks pretty good to me. These are the stats from the last 2.5 months which should reflect the worst period of the summer slump they measured:
NSDCC Sales Between July 1st and Sept. 15
| Year |
# of Sales $3M-$4M |
Median SP |
# of Sales $4M+ |
Median SP |
| 2017 |
30 |
$3,375,000 |
29 |
$4,995,000 |
| 2018 |
22 |
$3,315,595 |
28 |
$5,243,130 |
| 2019 |
32 |
$3,325,000 |
30 |
$6,382,500 |
| 2020 |
60 |
$3,372,776 |
51 |
$5,385,000 |
| 2021 |
74 |
$3,300,000 |
78 |
$5,650,000 |
| 2022 |
60 |
$3,450,000 |
57 |
$5,270,000 |
When I search the MLS for detached-home sales over $3,000,000 for the whole county between June and August, this is the result:
2021: 260
2022: 213
It doesn’t look like 55% off to me.
I have requested that Compass get into the real estate reporting business so media types have access to what’s really happening, instead of using Redfin’s stories which sensationalize the data to draw more attention to themselves, rather than help consumers properly interpret the market conditions.
by Jim the Realtor | Sep 22, 2022 | 1-story, Boomer Liquidations, Boomers |
No surprise that our new listing found a buyer already. The one-story homes with all the extras are probably the most attractive buys in the marketplace, and anyone can sell these – it’s just a matter of who can get what price.
I had 200+ people attend the open houses last weekend – and at least 90% of the people were seniors. Yet, NONE of them submitted an offer.
Think about that!
I thought this home would be a perfect match for those who are getting older and want to get out of their two-story home. Those looking to retire here and want a pool for the grandkids. Anyone fitting the typical downsizer profile.
While there were plenty of lookers, none of the seniors made an offer. Why?
- Are there hundreds of seniors just beginning their search?
- Are there seniors who thought they were legitimate buyers but couldn’t pull the trigger fast enough?
- Are there hundreds of seniors passing on the third one-story offering in this tract this year because of price? Anyone who lives nearby can sell theirs for a similar price and take their property-tax basis with them, so it’s just a swap of equity so why would price be a mental barrier?
- Is it the perceived difficulty of selling one and buying another?
- Are they just happy enough in their two-story home, but have a natural curiosity about living in a one-story? Is moving to a single-level just a nice idea?
Most of the attendees were getting around fine – there were just a couple of old guys limping around. My theory is that living in a two-story will be tolerated until the very end, and if it gets bad enough, you can always sleep on the couch downstairs!
What do you think?
by Jim the Realtor | Sep 21, 2022 | Interest Rates/Loan Limits |
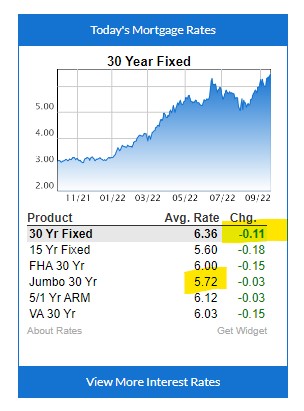
The Fed raises their rate by 0.75%, and what happens?
That’s right, the conforming 30-year fixed rate went down this afternoon.
Chairman Powell said again that intends to cause a reset in the real estate market, but our rates really shouldn’t go up much the rest of the year because at least 1% is already built into the current rates. If it weren’t for Powell’s threats, the 30-year fixed would be around 5.25% today (10-yr T-bill index + 1.75%).
Rob Dawg and Garry might have to wait until next year before we have a chance of seeing a 7% mortgage rate, and those of us in the higher-priced areas should keep our focus on the 30-year jumbo rate. It will be what most financed buyers around the coast will be getting.
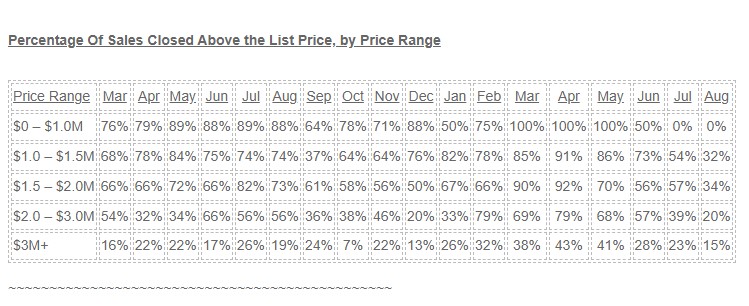
by Jim the Realtor | Sep 21, 2022 | 2022, Over List, Sales and Price Check |
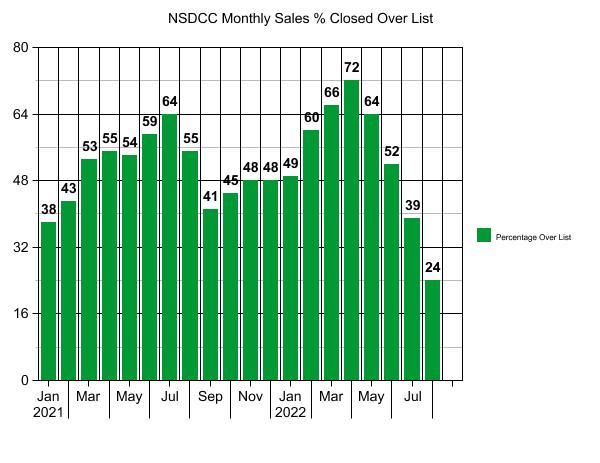
The over-bidding is winding down to more manageable levels as just 24% of August buyers were willing to pay over the list price. As usual, the $1,000,000 to $2,000,000 range was the most active, where inventory is low and the number of quality homes for sale even lower:
The number of sales in August were higher than they were in July, but still well under recent history:
NSDCC August Sales
2018: 275
2019: 263
2020: 351
2021: 268
2020: 161
~~~~~~~~~~~~~~~~~~~~~~~~~~~~~~~~~~~~~~~~~~~~~
NSDCC Average and Median Prices by Month
| Month |
# of Sales |
Avg. LP |
Avg. SP |
Median LP |
Median SP |
| Feb |
224 |
$2,298,797 |
$2,257,334 |
$1,719,500 |
$1,758,000 |
| March |
252 |
$2,295,629 |
$2,260,524 |
$1,800,000 |
$1,825,000 |
| April |
357 |
$2,396,667 |
$2,403,962 |
$1,799,900 |
$1,828,000 |
| May |
300 |
$2,596,992 |
$2,581,715 |
$1,900,000 |
$1,994,500 |
| June |
348 |
$2,509,175 |
$2,537,953 |
$1,900,000 |
$1,967,500 |
| July |
311 |
$2,421,326 |
$2,442,738 |
$1,795,000 |
$1,855,000 |
| Aug |
268 |
$2,415,075 |
$2,438,934 |
$1,897,000 |
$1,950,000 |
| Sept |
278 |
$2,479,440 |
$2,445,817 |
$1,899,000 |
$1,987,500 |
| Oct |
248 |
$2,754,470 |
$2,705,071 |
$1,899,000 |
$1,899,500 |
| Nov |
199 |
$2,713,693 |
$2,707,359 |
$1,999,000 |
$2,100,000 |
| Dec |
189 |
$2,686,126 |
$2,664,391 |
$1,985,000 |
$2,157,500 |
| Jan |
140 |
$2,828,988 |
$2,855,213 |
$2,234,944 |
$2,240,000 |
| Feb |
158 |
$3,063,331 |
$3,108,907 |
$2,149,500 |
$2,386,500 |
| Mar |
207 |
$3,247,251 |
$3,337,348 |
$2,400,000 |
$2,625,000 |
| Apr |
227 |
$3,190,161 |
$3,251,604 |
$2,350,000 |
$2,550,000 |
| May |
214 |
$2,941,080 |
$3,030,794 |
$2,350,000 |
$2,480,000 |
| Jun |
188 |
$2,871,956 |
$2,881,314 |
$2,297,500 |
$2,350,000 |
| Jul |
152 |
$2,892,729 |
$2,833,588 |
$2,272,000 |
$2,280,000 |
| Aug |
161 |
$2,953,967 |
$2,849,332 |
$2,200,000 |
$2,150,000 |
This is much more normal – the average and median sales prices are under their list prices!
by Jim the Realtor | Sep 20, 2022 | 2022, Frenzy Monitor, Jim's Take on the Market
The reason for breaking down the active and pending listings by zip code is to give the readers a closer look at their neighborhood stats. We’ve considered a 2:1 ratio of actives-to-pendings to be a healthy market.
While other areas in America are reporting a surge of inventory, it’s not happening here, at least not yet. Comparing the current stats to the last few months, there really isn’t any reason to be overly concerned:
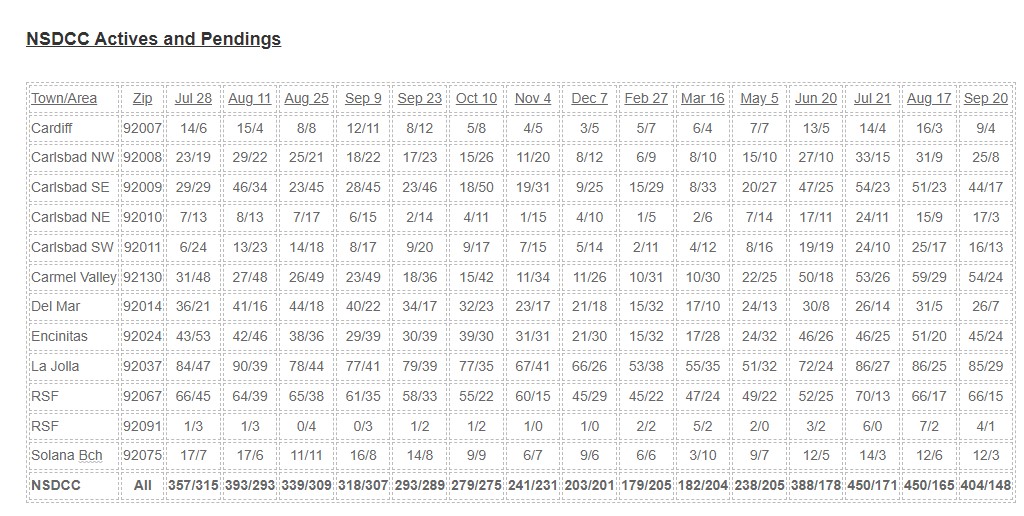
Taking out La Jolla and Rancho Santa Fe, the actives-to-pendings is 2.4-to-1 (249:103), which isn’t bad, all considered, and it’s the same ratio as it was last month.
The holiday season is less than a month away…..and the NFL season is already two weeks old. The Super Bowl is right around the corner, and so is the 2023 Selling Season!


