Five Bedrooms Are Hot
She got four offers on this one, and it closed for $1,945,000 cash and 10-day escrow:

She got four offers on this one, and it closed for $1,945,000 cash and 10-day escrow:
He’s in the elite group of top guitarists and definitely one of the most underrated:
Kayla’s brokerage is being bought by The Agency so they are rolling out new marketing:
Buyers who worry that their money doesn’t get them much these days will be bummed to hear that it’s probably not going to change.
The changes in the market forces are conspiring together to create less inventory, and a couple of big blows this year could really drive down the number of houses for sale in 2023.
Look at the trend so far:
Number of NSDCC detached-homes listed between January 1st and July 31st
| Year | |
| 2015 | |
| 2016 | |
| 2017 | |
| 2018 | |
| 2019 | |
| 2020 | |
| 2021 | |
| 2022 |
Why don’t people want to sell? Or why do those who might sell, talk themselves out of it so quickly?
Added to the list this year:
We know that over 80% of the existing mortgages have a rate that’s lower than what you can get today. Even if you could sell your home for top dollar, the thought of paying a higher interest rate is enough to stop potential sellers in their tracks.
But the last one is the killer.
Once sellers get the feeling that the market has cooled off and they might not be able to sell their home for their fantasy price, then it is WAY TOO EASY for them to suspend all thoughts of selling, and decide to wait until “the market gets better”.
Jay Powell thinks that raising rates will cause home prices to come down, but he didn’t talk to any homeowners about it. It’s only going to continue the trend of fewer homes coming to market, and keep pricing high.
The 2023 Selling Season could be an all-time dud, just because there will be so few homes available.
My quick tour of the home that garnered ten offers:
Sales are down, and listings are sitting longer, so it would be easy to assume the market is dead.
Buyers want it to believe the market is dead so they don’t have to act. They are seeing everything though doom-colored glasses, which reinforces that it’s a great time to play it safe.
I’ve been saying that buyers are on vacation, and I said it a little stronger on the video last night. But I’m sure there are some who think I’m just talking my book, and then gravitate back to the fence where it is really comfortable right now.
How can we tell if the market really is dead, or just taking a break?
The best way is to monitor the Zillow views and saves – and hope Zillow doesn’t manipulate those too.
Here is a cross-section of new listings this week:
According to the listing agent, they received TEN offers here. They accepted one, and has a backup too:

~~~~~~~~~~~~~~~~~~~~~~~~~~~~~~~~~~~~~
On Sunday morning, this listing right around the corner from the one above hit the MLS, which probably caused the losers from Palenque to rush over for a look.

~~~~~~~~~~~~~~~~~~~~~~~~~~~~~~~~~~~~
This is in a neighborhood that is notorious for small yards (they are detached condos officially), but this yard looks decent – check the views and saves here after just 4 days on the market:

~~~~~~~~~~~~~~~~~~~~~~~~~~~~~~~~~~~~~
Oh, yeah Jim but those are starter homes – what else do you have?
How about this new listing in Olde Carlsbad, which is not only a very eclectic area (i.e., lower comps nearby) but there is freeway noise and buses roll down Highland daily. Yet the agent had so much action on this new listing that she raised the price – substantially:

~~~~~~~~~~~~~~~~~~~~~~~~~~~~~~~~~~~~~~
Carmel Valley is known for its newer homes, and no one would be surprised if those dodge the bullet. But this was built in 1985!

~~~~~~~~~~~~~~~~~~~~~~~~~~~~~~~~~~~~
It’s not just the cheapies either:

~~~~~~~~~~~~~~~~~~~~~~~~~~~~~~~~~~~~~
Look at the number of Zillow views and saves!
Just based on those, there is a strong undercurrent of buyers who are monitoring the market closely – and with school starting, this has to be the worst week of the summer for distractions! We may coast through the rest of 2022, but don’t be surprised if the frenzy conditions bounce back in 2023!
My listing – how can I have this much action and not be optimistic:

The market will coast through the next few months, and then pick up during the selling season when both buyers and sellers decide to quit dancing around and just go for it (after they see others doing it too).
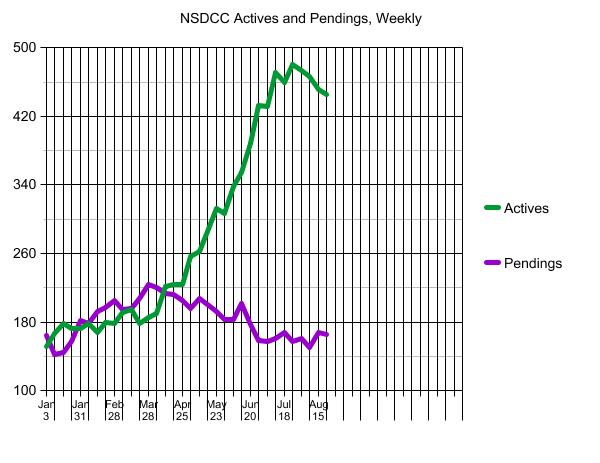
If there was a big surge of listings that weren’t selling, then we’d know for sure that the local market was in trouble. But we got so spoiled by the super-frenzy conditions last year where everything was selling right away that we forgot what it’s like during a non-frenzy.
Yep, when you compare to 2021, we have more active listings – in fact, there are 32% more $2,000,000+ listings today than there were at this time last year! But relatively speaking, the 340 is a low number:
NSDCC Detached-Home Active Listings, Third Week of August:
| Price Range | |||||
| 0 – $1.5M | |||||
| $1.5M – $2.0M | |||||
| $2.0M+ | |||||
| Total # of Listings |
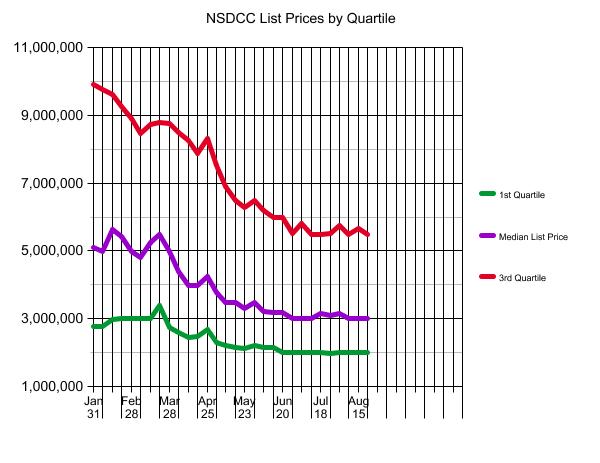
The inventory is top-heavy with 75% of the actives priced over $2,000,000, but we’ve been very dependent upon the affluent buyers for a while now – the people who are less sensitive to mortgage-rate fluctuations. The real problem is that you have never gotten so little for your money as you get today. If anyone can find a way to move up in price to buy a better home, it’s the affluent buyers!
~~~~~~~~~~~~~~~~~~~~~~~~~~~~~~~~~~~
The $0 – $1,500,000 Market:
| Date | ||||
| Jan 3, 2022 | ||||
| Jan 10 | ||||
| Jan 17 | ||||
| Jan 24 | ||||
| Jan 31 | ||||
| Feb 7 | ||||
| Feb 14 | ||||
| Feb 21 | ||||
| Feb 28 | ||||
| Mar 7 | ||||
| Mar 14 | ||||
| Mar 21 | ||||
| Mar 28 | ||||
| Apr 4 | ||||
| Apr 11 | ||||
| Apr 18 | ||||
| Apr 25 | ||||
| May 2 | ||||
| May 9 | ||||
| May 16 | ||||
| May 23 | ||||
| May 30 | ||||
| Jun 6 | ||||
| Jun 13 | ||||
| Jun 20 | ||||
| Jun 27 | ||||
| Jul 4 | ||||
| Jul 11 | ||||
| Jul 18 | ||||
| Jul 25 | ||||
| Aug 1 | ||||
| Aug 8 | ||||
| Aug 15 | ||||
| Aug 22 |
The $1,500,000 – $2,000,000 Market:
| Date | ||||
| Jan 3, 2022 | ||||
| Jan 10 | ||||
| Jan 17 | ||||
| Jan 24 | ||||
| Jan 31 | ||||
| Feb 7 | ||||
| Feb 14 | ||||
| Feb 21 | ||||
| Feb 28 | ||||
| Mar 7 | ||||
| Mar 14 | ||||
| Mar 21 | ||||
| Mar 28 | ||||
| Apr 4 | ||||
| Apr 11 | ||||
| Apr 18 | ||||
| Apr 25 | ||||
| May 2 | ||||
| May 9 | ||||
| May 16 | ||||
| May 23 | ||||
| May 30 | ||||
| Jun 6 | ||||
| Jun 13 | ||||
| Jun 20 | ||||
| Jun 27 | ||||
| Jul 4 | ||||
| Jul 11 | ||||
| Jul 18 | ||||
| Jul 25 | ||||
| Aug 1 | ||||
| Aug 8 | ||||
| Aug 15 | ||||
| Aug 22 |
The $2,000,000 – $3,000,000 Market:
| Date | ||||
| Jan 3, 2022 | ||||
| Jan 10 | ||||
| Jan 17 | ||||
| Jan 24 | ||||
| Jan 31 | ||||
| Feb 7 | ||||
| Feb 14 | ||||
| Feb 21 | ||||
| Feb 28 | ||||
| Mar 7 | ||||
| Mar 14 | ||||
| Mar 21 | ||||
| Mar 28 | ||||
| Apr 4 | ||||
| Apr 11 | ||||
| Apr 18 | ||||
| Apr 25 | ||||
| May 2 | ||||
| May 9 | ||||
| May 16 | ||||
| May 23 | ||||
| May 30 | ||||
| Jun 6 | ||||
| Jun 13 | ||||
| Jun 20 | ||||
| Jun 27 | ||||
| Jul 4 | ||||
| Jul 11 | ||||
| Jul 18 | ||||
| Jul 25 | ||||
| Aug 1 | ||||
| Aug 8 | ||||
| Aug 15 | ||||
| Aug 22 |
The $3,000,000 – $4,000,000 Market:
| Date | ||||
| Jan 3, 2022 | ||||
| Jan 10 | ||||
| Jan 17 | ||||
| Jan 24 | ||||
| Jan 31 | ||||
| Feb 7 | ||||
| Feb 14 | ||||
| Feb 21 | ||||
| Feb 28 | ||||
| Mar 7 | ||||
| Mar 14 | ||||
| Mar 21 | ||||
| Mar 28 | ||||
| Apr 4 | ||||
| Apr 11 | ||||
| Apr 18 | ||||
| Apr 25 | ||||
| May 2 | ||||
| May 9 | ||||
| May 16 | ||||
| May 23 | ||||
| May 30 | ||||
| Jun 6 | ||||
| Jun 13 | ||||
| Jun 20 | ||||
| Jun 27 | ||||
| Jul 4 | ||||
| Jul 11 | ||||
| Jul 18 | ||||
| Jul 25 | ||||
| Aug 1 | ||||
| Aug 8 | ||||
| Aug 15 | ||||
| Aug 22 |
The $4,000,000+ Market:
| Date | ||||
| Jan 3, 2022 | ||||
| Jan 10 | ||||
| Jan 17 | ||||
| Jan 24 | ||||
| Jan 31 | ||||
| Feb 7 | ||||
| Feb 14 | ||||
| Feb 21 | ||||
| Feb 28 | ||||
| Mar 7 | ||||
| Mar 14 | ||||
| Mar 21 | ||||
| Mar 28 | ||||
| Apr 4 | ||||
| Apr 11 | ||||
| Apr 18 | ||||
| Apr 25 | ||||
| May 2 | ||||
| May 9 | ||||
| May 16 | ||||
| May 23 | ||||
| May 30 | ||||
| Jun 6 | ||||
| Jun 13 | ||||
| Jun 20 | ||||
| Jun 27 | ||||
| Jul 4 | ||||
| Jul 11 | ||||
| Jul 18 | ||||
| Jul 25 | ||||
| Aug 1 | ||||
| Aug 8 | ||||
| Aug 15 | ||||
| Aug 22 |
NSDCC Weekly New Listings and New Pendings
| Week | ||||
| Jan 3, 2022 | ||||
| Jan 10 | ||||
| Jan 17 | ||||
| Jan 24 | ||||
| Jan 31 | ||||
| Feb 7 | ||||
| Feb 14 | ||||
| Feb 21 | ||||
| Feb 28 | ||||
| Mar 7 | ||||
| Mar 14 | ||||
| Mar 21 | ||||
| Mar 28 | ||||
| Apr 4 | ||||
| Apr 11 | ||||
| Apr 18 | ||||
| Apr 25 | ||||
| May 2 | ||||
| May 9 | ||||
| May 16 | ||||
| May 23 | ||||
| May 30 | ||||
| Jun 6 | ||||
| Jun 13 | ||||
| Jun 20 | ||||
| Jun 27 | ||||
| Jul 4 | ||||
| Jul 11 | ||||
| Jul 18 | ||||
| Jul 25 | ||||
| Aug 1 | ||||
| Aug 8 | ||||
| Aug 15 | ||||
| Aug 22 |

For new homes, it’s mostly just infill projects now in the prime areas so even the big boys are looking for smaller projects. It looks like Toll picked this up for $12 million last October, and they are going to build 4,765sf to 6,036sf houses that are the same or similar to what they built at Palomar in PHR.
Yesterday, they sent emails saying prices will start at $3,500,000 for the 25 houses, which means they should get into the $4-millions pretty quick. Here’s what their biggest model in PHR looked like just four years ago, which coincidentally is up for resale, priced at $5,995,000:

https://www.tollbrothers.com/luxury-homes-for-sale/California/Del-Mar-Mesa-Estates

These guys are among the most negative in the business, so if they have San Diego County home prices changing –3.65% between now and the end of 2023, and then -2.9% by the end of 2024, then prices in the better areas will be positive.
The most likely to happen is that we’ll see a few wild sales at the extreme ends, and those will get the headlines. The rest will be +/-5% of the comps. Most will just fumble along – just like during the frenzy – with little or no quality data or advice.
https://fortune.com/2022/08/15/falling-home-prices-to-hit-these-housing-markets-in-2023-and-2024/


Are you looking for an experienced agent to help you buy or sell a home?
Contact Jim the Realtor!
CA DRE #01527365, CA DRE #00873197
