
The reason for breaking down the active and pending listings by zip code is to give the readers a closer look at their neighborhood stats.
Given how inventory has been dropping significantly, it is impressive how many pendings there are:
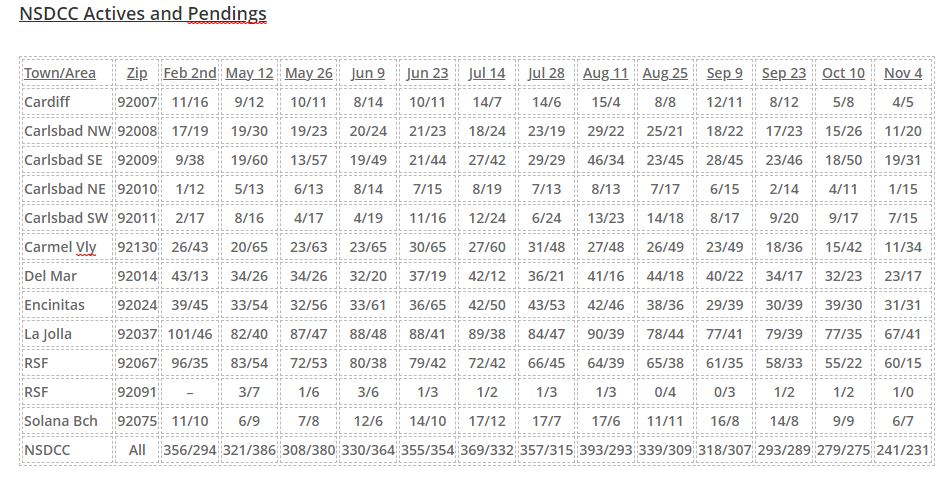
We had 400+ pendings from June 22nd to November 30th last year – with a peak of 491 pendings on September 7, 2020.
We can also track the average market times too. Any upward trends here would indicate market slowing:
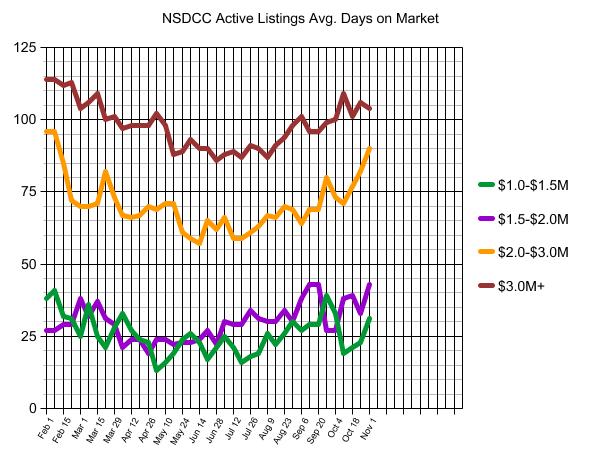
Buyers are pickier than ever, so no surprise that some dogs aren’t selling.


