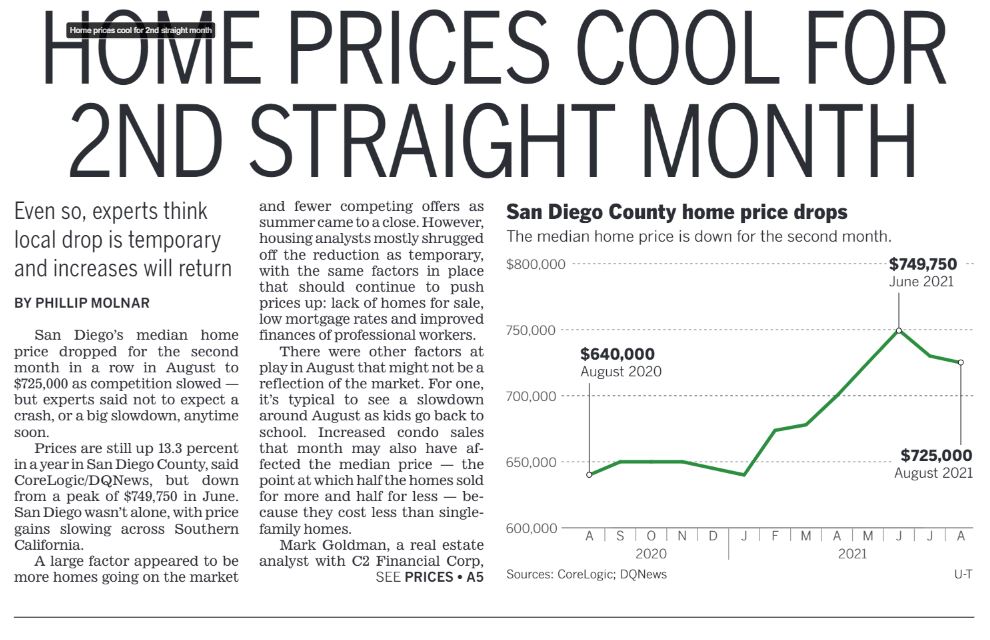
My favorite pet peeve of the media insisting that ‘home prices’ and market conditions are interchangeable with the direction of the median-sales-price made the front page of the newspaper today.
Here are other factors they mentioned in the story:
The number of listings in August were 47% fewer than in August, 2019.
The median sales price for condos hit an all-time high, as more buyers get priced out of single-family homes and are forced to consider other alternatives.
The quality of the homes for sale was crap.
The truth? Due to seasonality – which does play a role as summer closes out – it is better to compare to previous Augusts, not July. But the best indicator of market health is the number of sales:
San Diego County Detached-Home Sales, August
Year
Number of August Sales
Median Sales Price
Median Days on Market
2017
2,445
$610,000
19
2018
2,145
$660,000
19
2019
2,207
$650,000
19
2020
2,380
$739,000
9
2021
2,225
$850,000
10
There have been fewer listings (-16% YTD) than in 2019, yet there were MORE AUGUST SALES!
Never mind that the +15% YoY increase in the median sales price was an all-time high for August, and ignoring that the median market time was nearly identical to August, 2020 (which will go down as the most hysterical frenzy in the history of real estate), just that the number of sales last month were similar to previous Augusts indicates that the market is fine.
Yet the UT headline writer wants you to think there’s a problem.
One factor that will slow down the exodus is the increased difficulty of moving out of state – it’s not easy, or cheap, to buy a home outside of California any more. But fewer people leaving will mean less inventory – and could ramp up the frenzy in 2022.
The researchers used open-source data from Zillow or other providers to score the top 100 overvalued or undervalued metro areas in the nation, ranking the cities by a percent premium homebuyers are paying in today’s market based on a history of past pricing.
Here’s how the top 10 rankings landed, according to the research:
Boise, Idaho, where homes are selling at an 80.6% premium.
Austin, Texas, at a 50.7% premium.
Ogden, at a 49.7% premium.
Provo, at a 46.2% premium.
Detroit, at a 45.6% premium.
Spokane, Washington, at a 45.2% premium.
Salt Lake City, Utah, at a 42.4% premium.
Phoenix at a 42.3% premium.
Las Vegas at a 41.9% premium.
Stockton, California, at a 38.5% premium.
The typical value of homes in Boise was over $523,300 as of the end of August, up more than 46% over the past year, according to Zillow.
Environmentalists and union laborers are working on a ballot initiative that could be some form of property or parcel tax to fund needed improvements and infrastructure in how we handle stormwater.
SANDAG and supporters of transit have been talking about the need for a new tax measure to expand the options people have to get around San Diego.
And we broke the news here that the largest labor union of city of San Diego workers has joined with the philanthropists behind the Library Foundation and Parks Foundation to support a measure that would implement a parcel tax to bring in more revenue to support libraries and parks in the city.
There’s a lot of tax talk going on.
And now there’s more.
The Building Industry Association, which is only a few weeks out from installing a new CEO, has outlined an ambitious plan to try to spur the creation of more affordable and middle-income housing. And one feature of it is to put a fee on real estate transactions.
It’s not something the group is determined to pursue but the idea has now advanced far enough to reportedly irk some of its allies. It’s part of a document the group is working on called a Three-Pronged Approach to Finance and Build Additional Restricted Affordable Housing in San Diego.
“This transfer tax (% to be determined) should be charged only at the point of a property sale, and should only be charged on the amount of property value increase a property owner received,” the document reads.
Lori Holt Pfeiler, the new CEO of BIA San Diego, cautioned the idea is just that – an idea. And she was a bit frustrated that the Politics Report got a hold of the document laying it out because she hadn’t had a chance to really discuss it and have partners, like real estate friends who have partnered with the BIA over the years, to influence it and get on board.
Tony Manolatos, who serves as a spokesman for the BIA, told the Politics Report that he wouldn’t be surprised if the measure was advanced for the November 2022 ballot.
“They haven’t settled on any tactics,” he said. “There is a real sense of urgency, though, to create more housing especially for the middle class.”
Governor Newsom signed SB 9 yesterday, but it won’t change much because building an ADU is cost prohibitive. How many people need one bad enough that they would spend $50,000 to $100,000 and go through the hassle? Plus the number of available parcels will limit how many could get built:
On Sept. 16, two days after winning the recall election, Gov. Gavin Newsom signed the bill into law, despite pleas from cities to veto it.
But some analysts say the linchpin of the Senate’s housing package would probably have a negligible impact on the California housing crisis, at least in the short-term. As for the nightmare scenario described by opponents? There simply isn’t enough evidence to back that up, either.
That’s because a change to zoning means very little in reality, starting with the number of units that would actually get built, these analysts say.
Development would be realistic in only about 410,000 parcels in California at most, or 5.4% of land now occupied by single-family houses, according to a new study by the Terner Center for Housing Innovation at UC Berkeley based on the version of the bill without the new amendments.
That could add a total of 700,000 new units across California, if every single homeowner for whom the change made sense chose to develop. “Overall, that’s a sliver of the 7.5 million single-family homes throughout the state,” said David Garcia, policy director for the Terner Center.
One of the new amendments — which requires owners to live in the home for at least three years after they split their lots and build as many as four units — cuts the potential total of new units by 40,000, or 6%.
The analysis was conducted using current land values and development costs, so the number of feasible units could change. But Garcia said that was unlikely in the near-term. The study found that the typical property owner could not afford to build a second unit, much less a third or fourth. Other barriers: The new split lot couldn’t be less than 1,200 square feet, and historic districts, fire hazard zones and some rural areas would be barred from development.
“You would not see the wholesale bulldozing of single-family homes, as we’ve seen characterized in many of the public comments in committee hearings,” Garcia said. “There’s just no financial basis for that fear.”
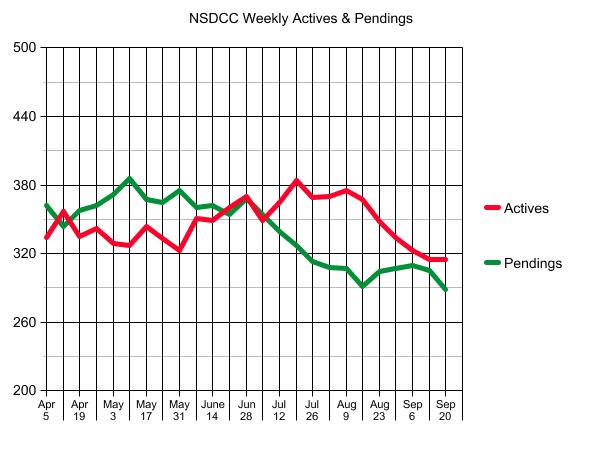
Home buyers don’t have much – if any – control over the process, which leads to frustration and disappointment. They don’t have any way to cause more homes to list for sale, and the only way to eliminate the competition is to out-bid them, which can be even more harrowing.
One solution is for buyers to expand their parameters, but that’s not easy and can lead to another ailment that a client described yesterday as “frozen in indecision”.
Just when you want to give up……it looks like others might have beaten you to it!
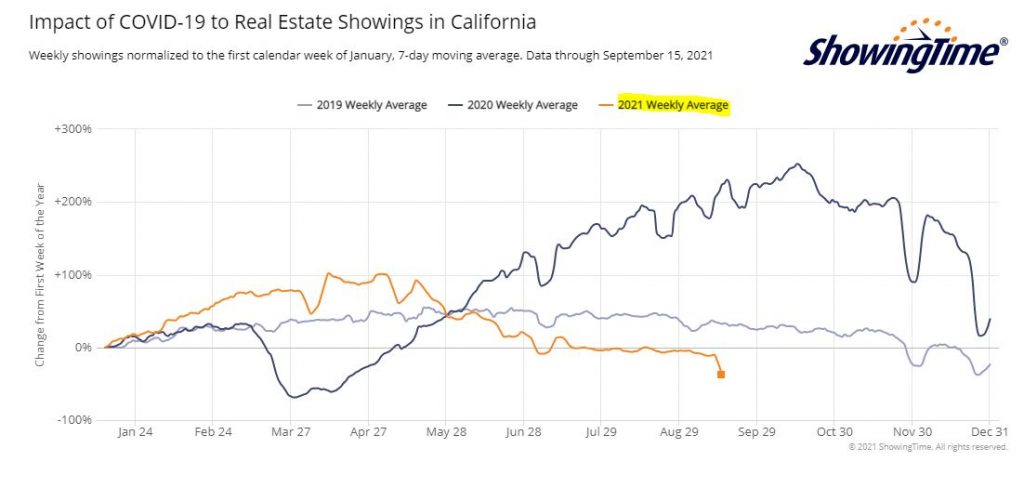
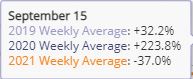
Showings throughout the state are lower than they were during the first week of January!
It’s been mentioned that not every agent uses this service, but it is such a large sample size that the trend should be a decent indicator of buyer sentiment – they’re exhausted.
Sure, active listings are half of what they were at this time last year, but the showings are 260% different!
Just like with selling, when is the best time to be a buyer? When no one else is!
We already know what’s going to happen with sales in 2022 – they will be the same as this year, with a possible adjustment of +/- 10%.
But the rest of 2021 could get wacky!
It looks like the competition is dwindling, and any seller who comes to market around the holidays has to be motivated! Buyers – stay in the hunt!