To help get a sense of the frenzy conditions, let’s monitor the number of active & pending listings per area.
If the active (unsold) listings start to rise, we will know that pricing is becoming an issue.
But so far, the demand for detached homes between Carlsbad and La Jolla is solid, and buyers are enduring prices that are 20% to 30% higher than last year:
NSDCC Actives and Pendings
Town or Area
Zip Code
Actives/Pendings, Feb 2nd
May 12th
May 26th
Cardiff
92007
11/16
9/12
10/11
Carlsbad NW
92008
17/19
19/30
19/23
Carlsbad SE
92009
9/38
19/60
13/57
Carlsbad NE
92010
1/12
5/13
6/13
Carlsbad SW
92011
2/17
8/16
4/17
Carmel Valley
92130
26/43
20/65
23/63
Del Mar
92014
43/13
34/26
34/26
Encinitas
92024
39/45
33/54
32/56
La Jolla
92037
101/46
82/40
87/47
RSF
92067
96/35
83/54
72/53
RSF
92091
–
3/7
1/6
Solana Beach
92075
11/10
6/9
7/8
NSDCC
All Above
356/294
321/386
308/380
The 92009, 92011 and 92130 (SE Carlsbad, SW Carlsbad, and Carmel Valley) are scorching hot, with 4x, 4x and 3x as many pendings as actives! But Rancho Santa Fe is the most impressive of all. There have been times when there were 10x as many actives as pendings in 92067 – today it’s 1.4x!
With the 30-day closings, there shouldn’t be any drastic changes here – let’s examine the trends over time.
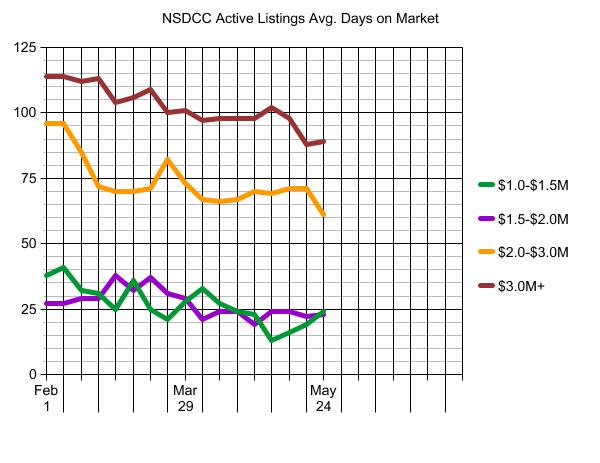
We can also track the average market times too. Any upward trends here would indicate market slowing:
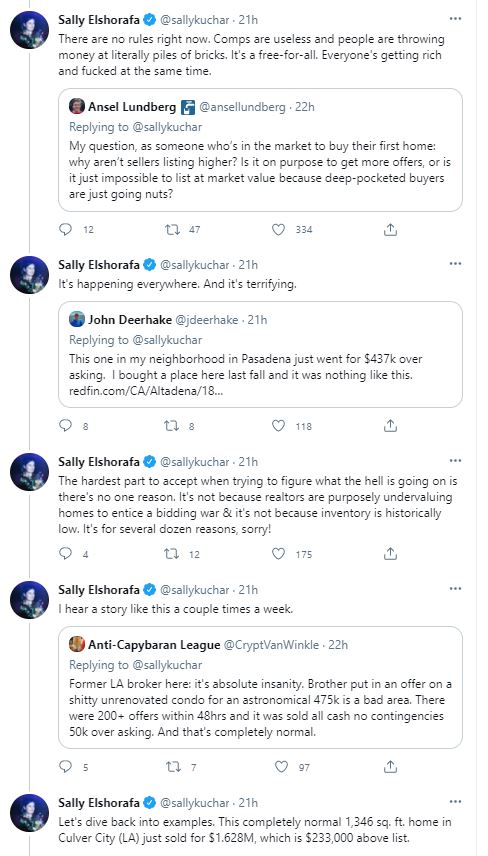
If you enjoy reading stories on the real estate insanity around the state and elsewhere, here’s a solid collection of 100+ over-list examples and buyer despair:
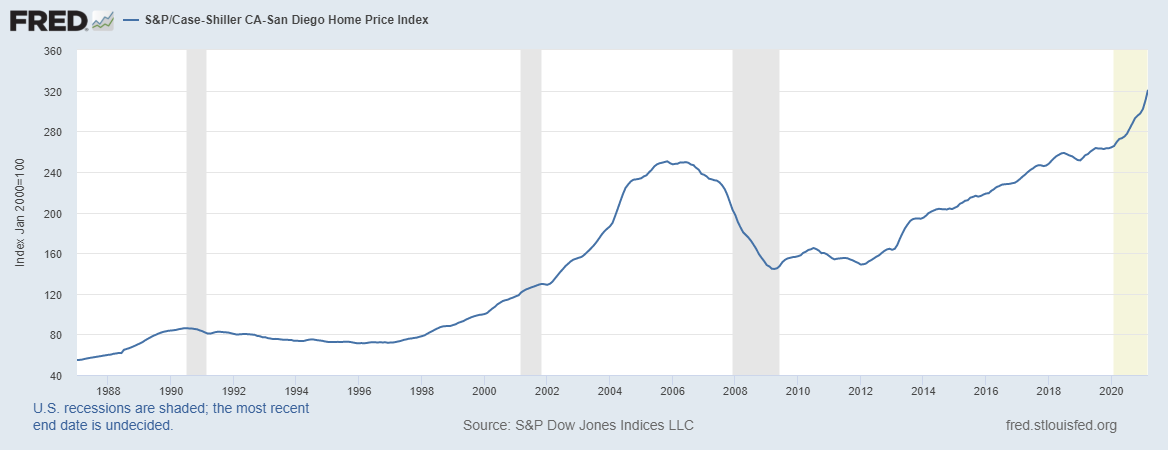
San Diego has had positive gains straight through the Covid-19 era, and we are really ramping up in 2021 with a 3.3% monthly gain in March! We kept our #2 spot in the nation, and are right behind Phoenix:
Home prices in March were 13.2% higher in March, compared with March 2020, according to the S&P CoreLogic Case-Shiller National Home Price Index. That’s up from the 12% annual gain in February, and it marks the 10th straight month of accelerating home prices.
The March gain is the largest since December 2005 and is one of the largest in the index’s 30-year history. Prices are being pushed higher by incredibly strong competition in the market. High demand is butting up against near record-low supply, resulting in bidding wars for the vast majority of listings.
The 10-city composite rose 12.8% year over year, up from 11.7% in the previous month. The 20-city composite increased 13.3%, up from 12% in February.
Cities with the strongest price gains continue to be Phoenix, San Diego and Seattle. Phoenix sits at the top with 20% year-over-year price increase, followed by San Diego with a 19.1% increase and Seattle prices rising 18.3%. All 20 cities reported higher price increases in the year ending March 2021 versus the year ending February 2021.
“These data are consistent with the hypothesis that Covid has encouraged potential buyers to move from urban apartments to suburban homes,” said Craig Lazzara, managing director and global head of index investment strategy at S&P DJI.
“This demand may represent buyers who accelerated purchases that would have happened anyway over the next several years. Alternatively, there may have been a secular change in preferences, leading to a permanent shift in the demand curve for housing,” he added.
Mortgage rates began rising during this period, with the average rate on the 30-year fixed just below 3% in February and then ending March at around 3.4%, according to Mortgage News Daily. Higher mortgage rates cut into purchasing power and usually put a chill on home prices, but clearly unusual competition in the market is overwhelming the usual mechanics of the market.
Only 1.16 million homes were on the market in April, a 20% drop year over year, according to the National Association of Realtors. The continued shortage of homes, especially at the lower end of the market, forecasts that home prices will not cool off any time soon.
Sales are beginning to weaken, and prices usually follow, but again, the usual trends are not dependable in this very unusual housing market.
Shiller has been too conservative on his predictions because he’s an ivory-tower guy. If he were to talk to potential home sellers, he’d find that there aren’t many – if any – who have to move so badly that they would sell for “substantially lower” prices. The next phase after the frenzy will be the stagnant/plateau stage where the demand thins out and sellers wait for that perfect nuclear family with 2.2 kids to come along some day.
Nobel prize-winning economist Robert Shiller is worried a bubble is forming in some of the market’s hottest trades. He’s notably concerned about housing, stocks and cryptocurrencies, where he sees a “Wild West” mentality among investors.
“We have a lot of upward momentum now. So, waiting a year probably won’t bring house prices down,” Shiller said.
According to Shiller, current home price action is also reminiscent of 2003, two years before the slide began. He notes the dip happened gradually and ultimately crashed around the 2008 financial crisis.
“If you go out three or five years, I could imagine they’d [prices] be substantially lower than they are now, and maybe that’s a good thing,” he added. “Not from the standpoint of a homeowner, but it’s from the standpoint of a prospective homeowner. It’s a good thing. If we have more houses, we’re better off.”
Even if the NSDCC weekly count doubled from the 69 we had in the last week, the May 2021 listings total will barely get to 400, which is well under last year’s covid count:
NSDCC May Listings
Year
NSDCC Total Listings, May
Median List Price
2017
507
$1,370,000
2018
522
$1,399,450
2019
502
$1,450,000
2020
484
$1,579,716
2021
269
$2,050,000
The YoY increase in the median list price is 30%!
With half of the homes selling over list, the increase in the 2021 pricing is going to be an all-timer!
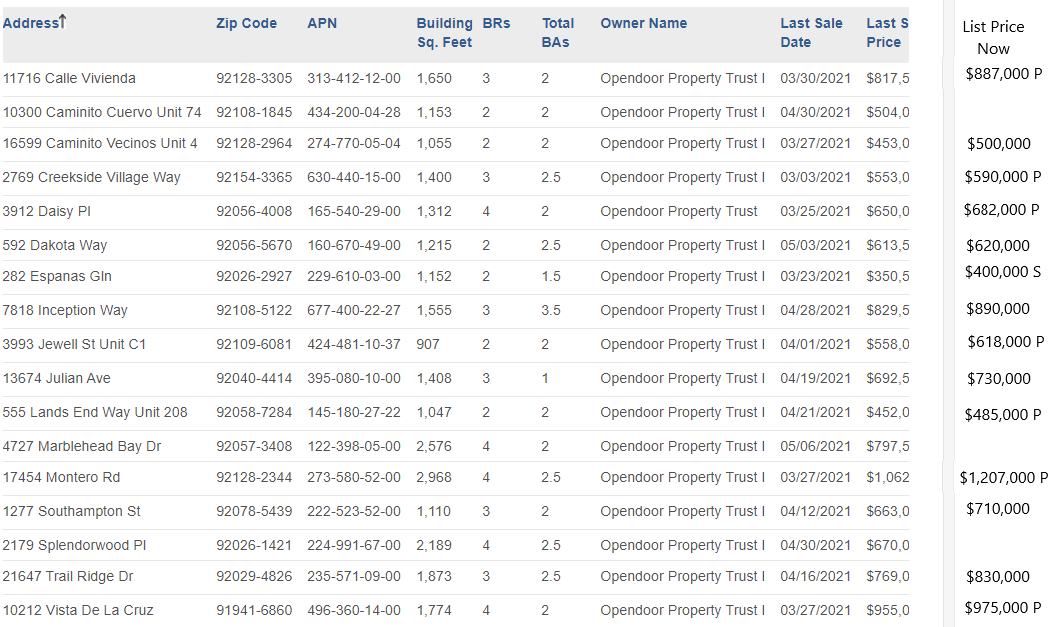
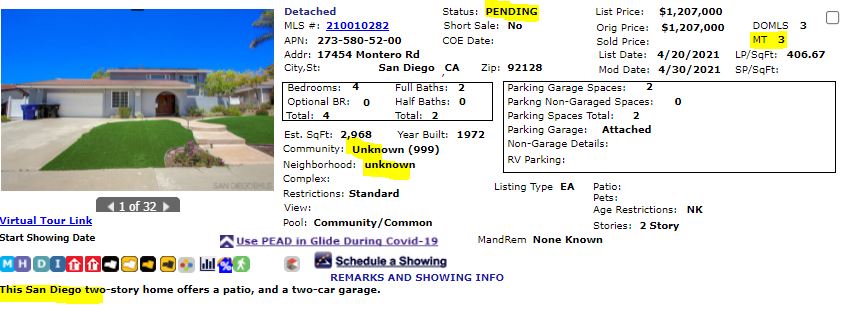
The other big ibuyer has begun operations in San Diego County.
How are they doing? The P is for pending sale, and the S is their first sold:
Three of the homes aren’t on the market yet, but let’s look at 14 properties that are.
They are happy to offer you a sales price that is close to the retail book value on paper, but then when they come out to visit in person, they find stuff wrong and have to deduct a big chunk to compensate.
Cash purchases: $9,418,000. Their 8.5% repairs/commissions fee: $800,530.
Net proceeds to sellers: $8,617,470.
How does it compare to selling the old analog way? Let’s assume the sellers Got Good Help, and reap the benefit of the frenzy conditions (instead of the ibuyer) when their sales price gets bid up. Let’s apply the standard 5% over-list premium to the total of the list prices above:
Difference between selling to OD, and selling with me: $1,268,616/14 = average $90,615 more per seller.
How are they selling their properties? The first few were listed with an Orange County broker, but now they have gone in-house and are listed with their Phoenix-based brokerage and agent – who got his California license less than a year ago. Hey, it’s Frenzy-2021 so they don’t have to try too hard to get properties into escrow. They offer 2% commissions with a brief description and boom – off to escrow:
The frenzy is helping to accelerate the dumbing-down of the real estate business.
There are sellers who get a postcard in the mail that offers quick cash and because the price is more than it used to be, they roll over and take it, all in the name of convenience.
For us data geeks, here are some raw numbers to ponder.
Between La Jolla and Carlsbad, there are three prime zip codes – 92009 (SE Carlsbad), 92024 (Encinitas), and 92130 (Carmel Valley) – that are the dominant target zones for buyers of the mid-range home (which today is $1.2M to $2.0M).
According to the Census, there are a total of 35,146 one-unit single-family residences in these three zips, so let’s use this mid-range group to consider the trends:
Number of Listings & Sales, May 1 to Apr 30
Year
# Listings
# Sales
L/S
Median SP
2009-10
710
366
1.9
$770,000
2010-11
748
448
1.7
$739,500
2011-12
771
427
1.7
$775,000
2012-13
1,272
769
1.7
$820,000
2013-14
2,216
1,488
1.5
$895,250
2014-15
2,157
1,467
1.5
$949,000
2015-16
2,366
1,506
1.6
$989,550
2016-17
2,252
1,564
1.4
$1,072,500
2017-18
1,833
1,400
1.3
$1,160,000
2018-19
2,092
1,340
1.6
$1,241,250
2019-20
1,835
1,334
1.4
$1,260,000
2020-21
1,906
1,606
1.2
$1,440,000
All
20,163
13,715
1.5
$1,075,000
My thoughts:
The most-recent inventory count is in line with previous years – it is the number of sales that are so astonishing. The big winners are those inferior homes that are getting scooped up in the frenzy, for which buyers are overpaying just to win something.
In an area of 35,146 houses, there are 86 for sale today (0.2%), with a median list price of $2,124,500. No wonder the inferior homes are getting scooped up.
Buyers on the lower-end have to feel like they are getting closer to being priced out every day.
Of the 13,715 recent sales, 10,000 of them were probably forever homes – or forever rentals – and unlikely to come back onto the market for 10-20 years (at best). The lean inventory will continue just because we won’t have the turnover we’ve had in past decades when it was easier to move around.